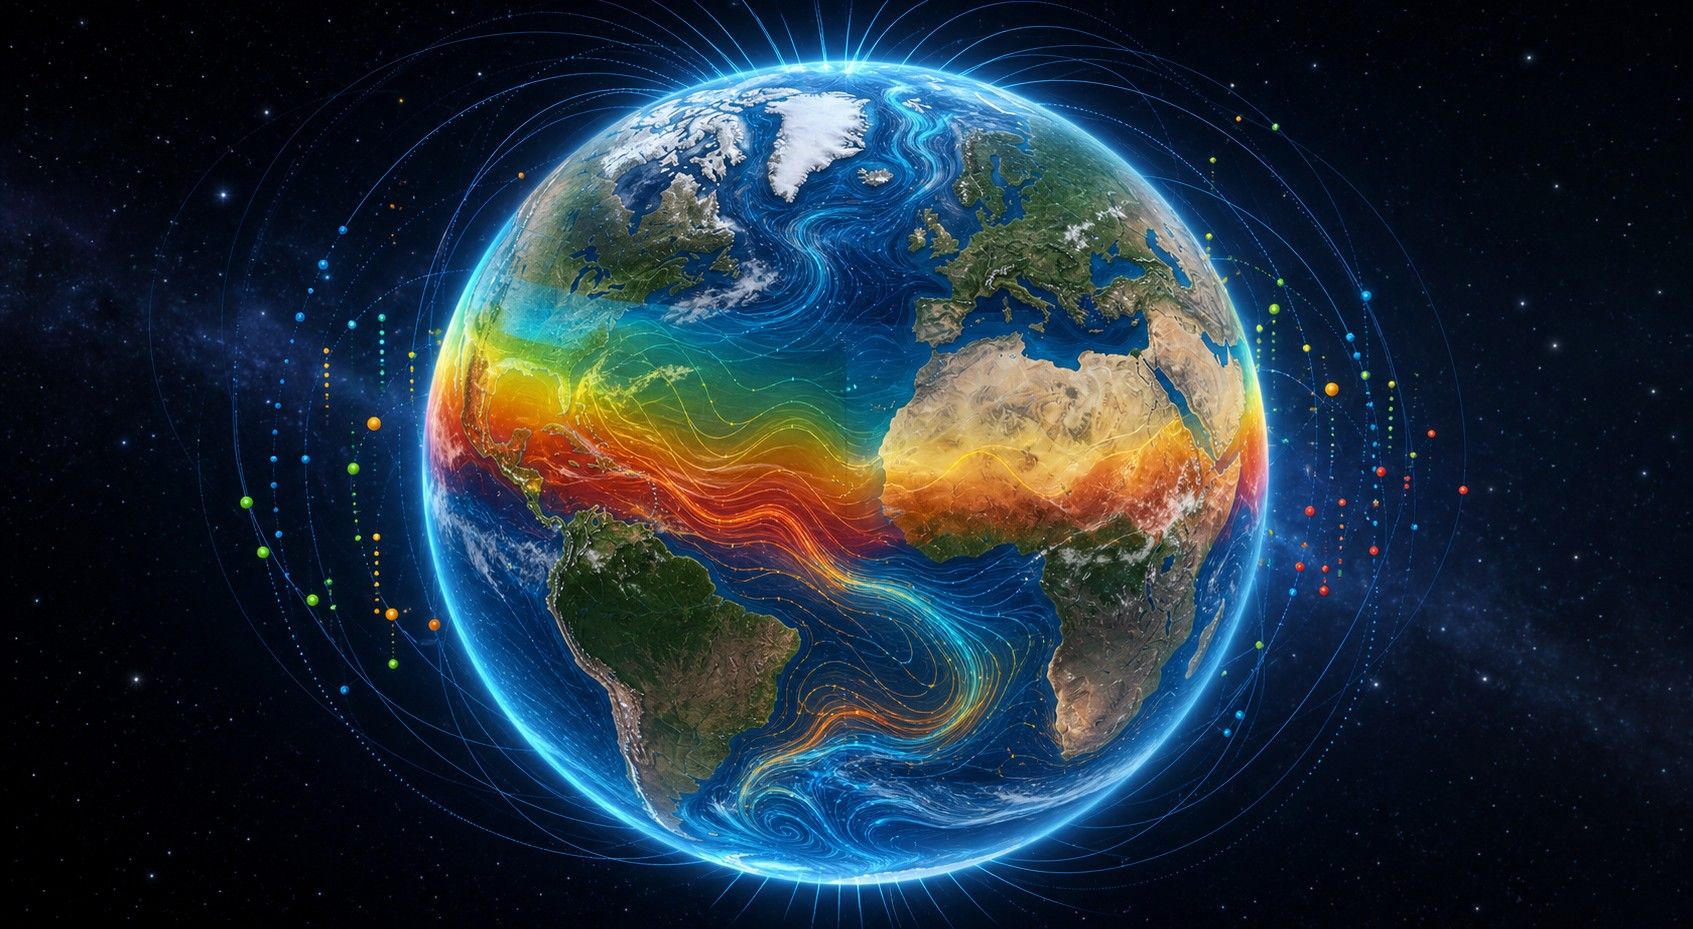
Climate and Environment Layers on a 3D Globe: See Earth as a Living System
LiveGlobe 3D visualizes climate heatmaps, ocean temperatures, Earth's magnetic field, day and night, and environmental layers on an interactive 3D globe.
Short clips
The app in motion: short, genuine glimpses straight from use.
At a glance
How the app feels on your phone.
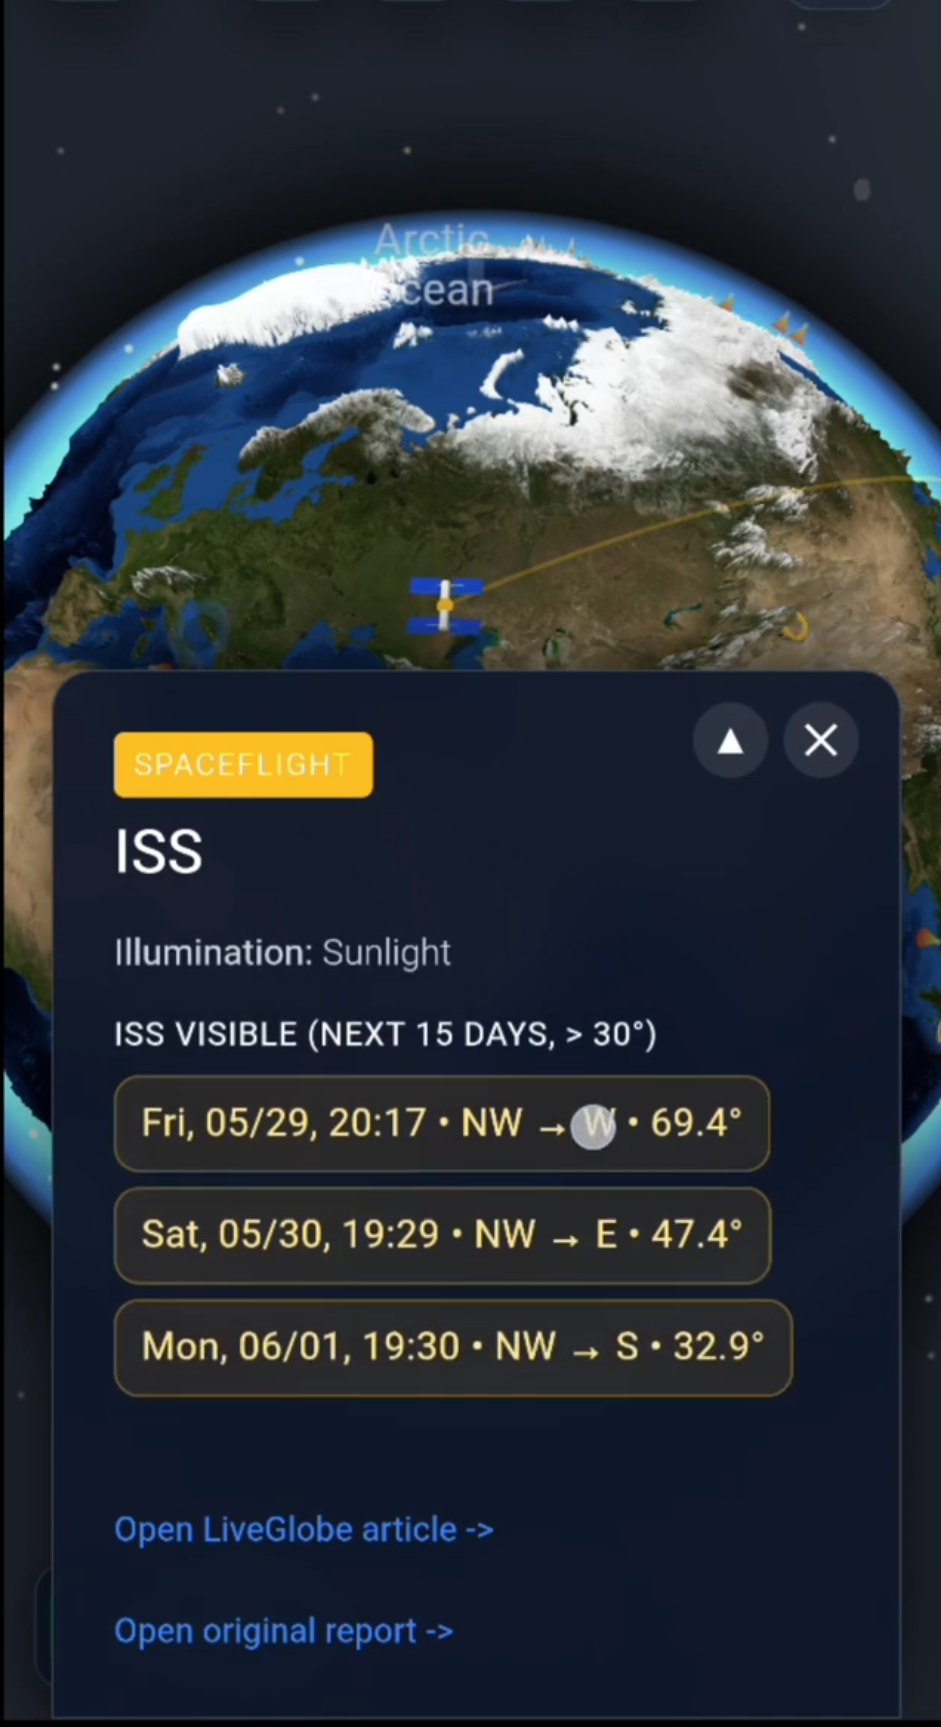
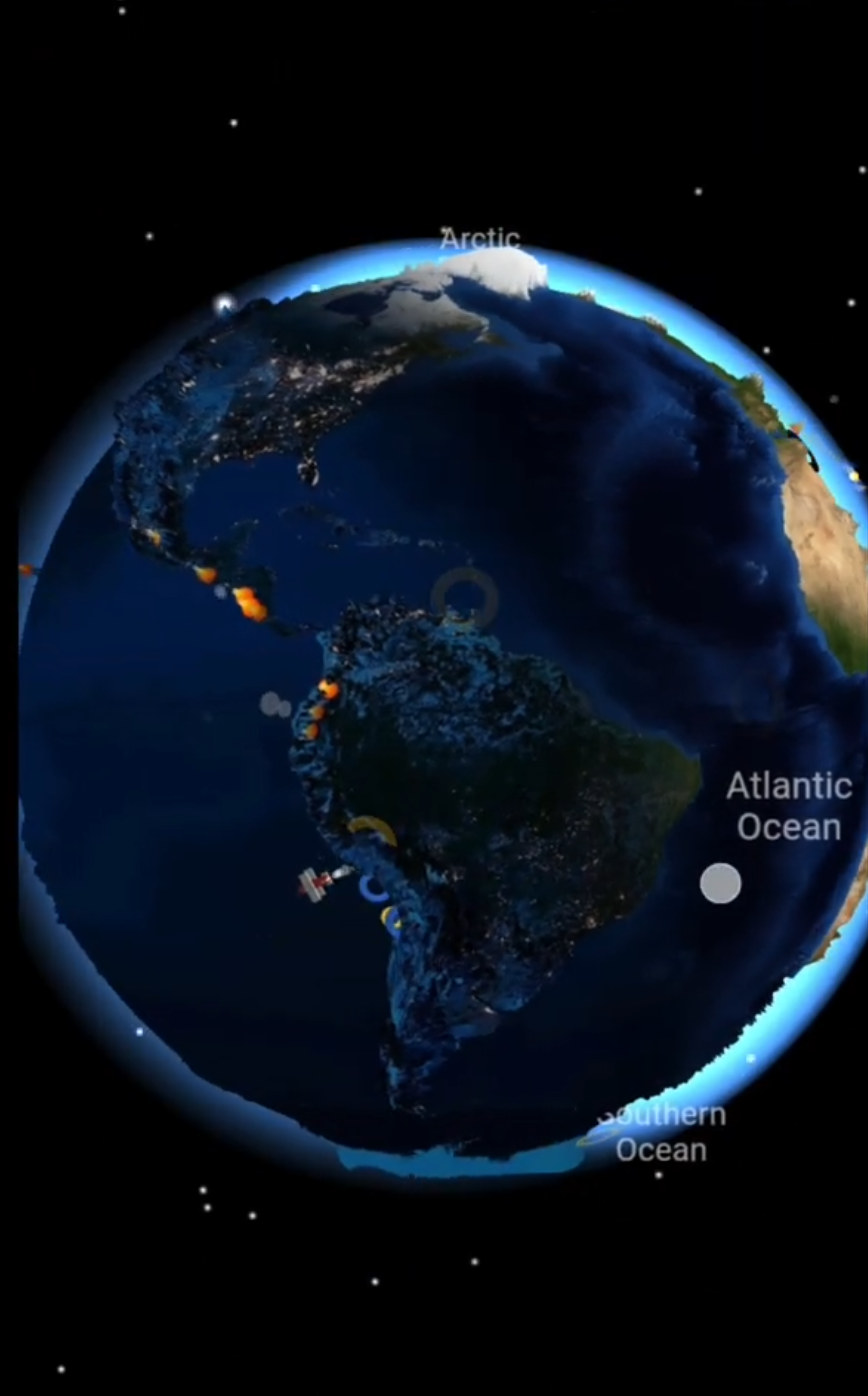
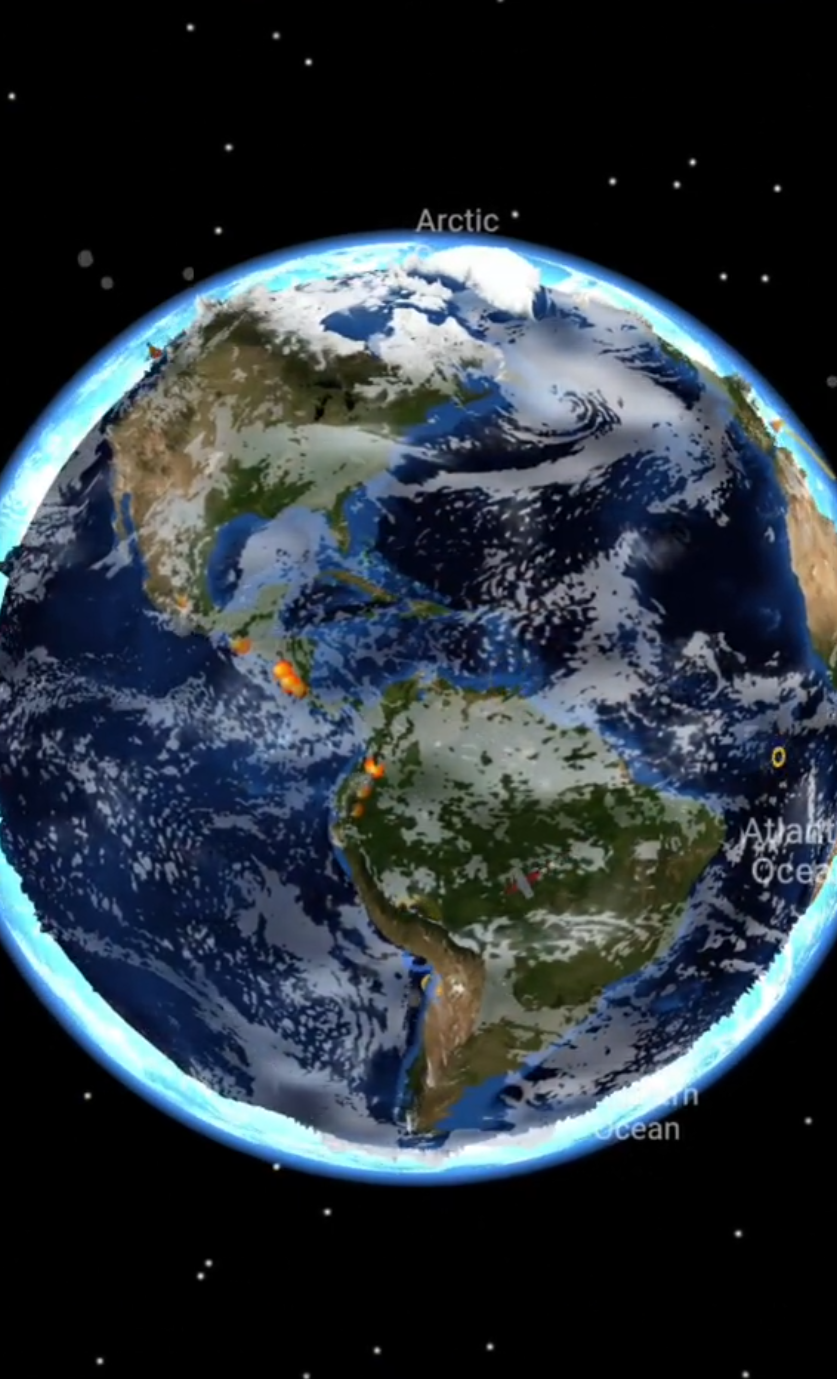
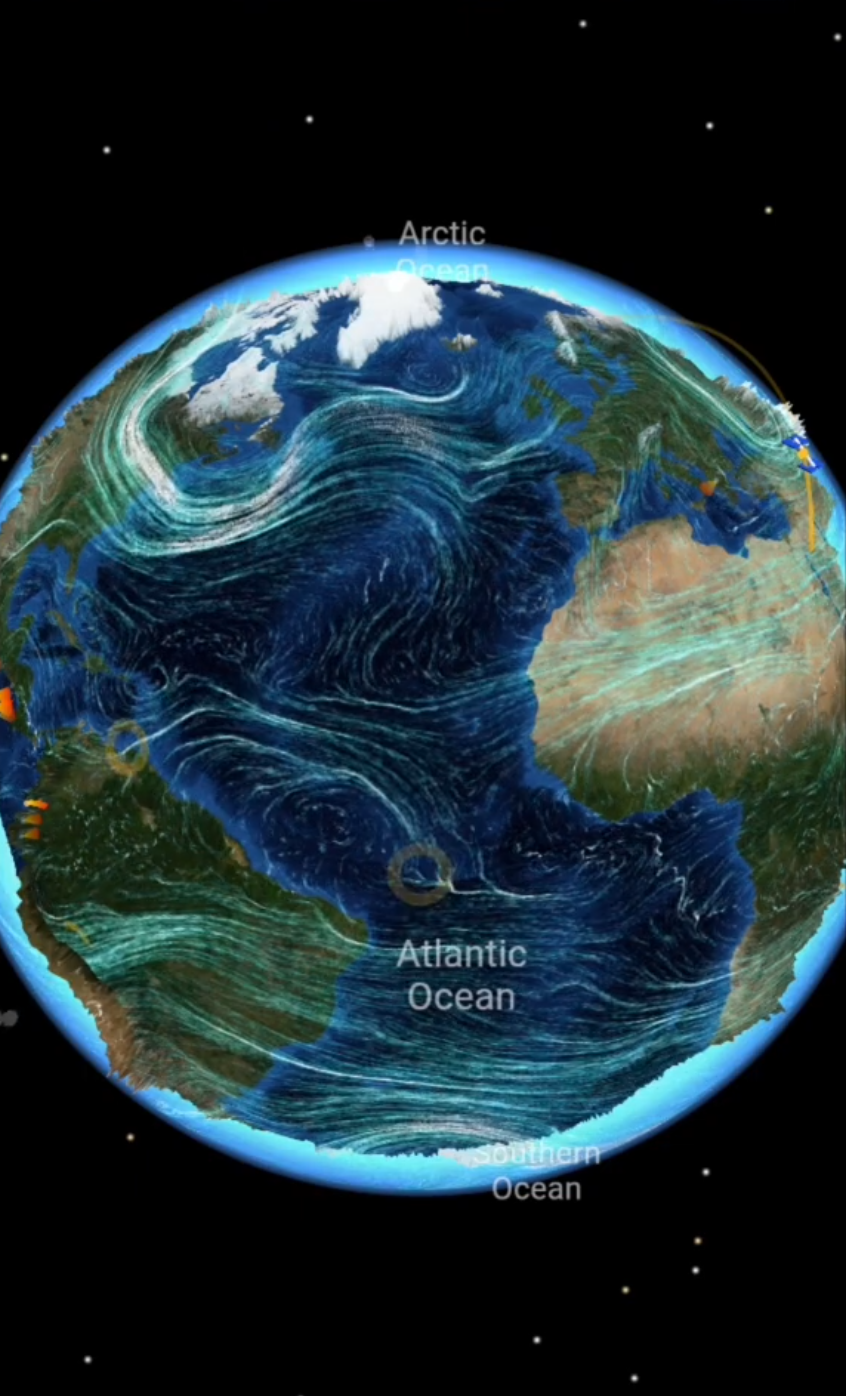
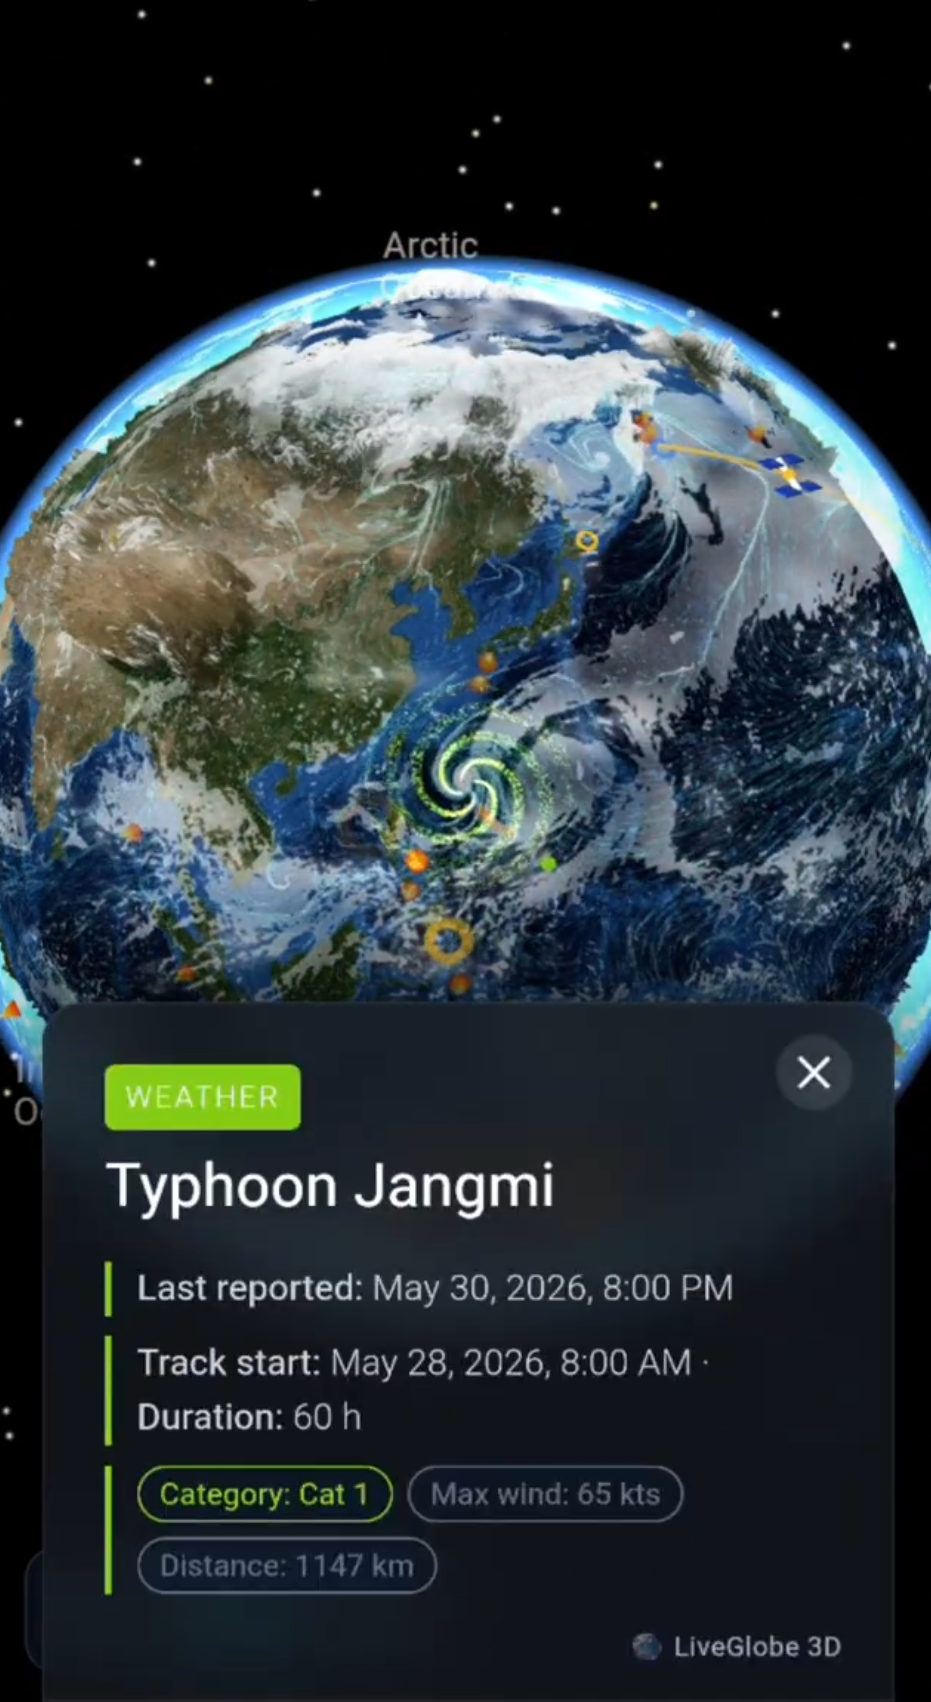
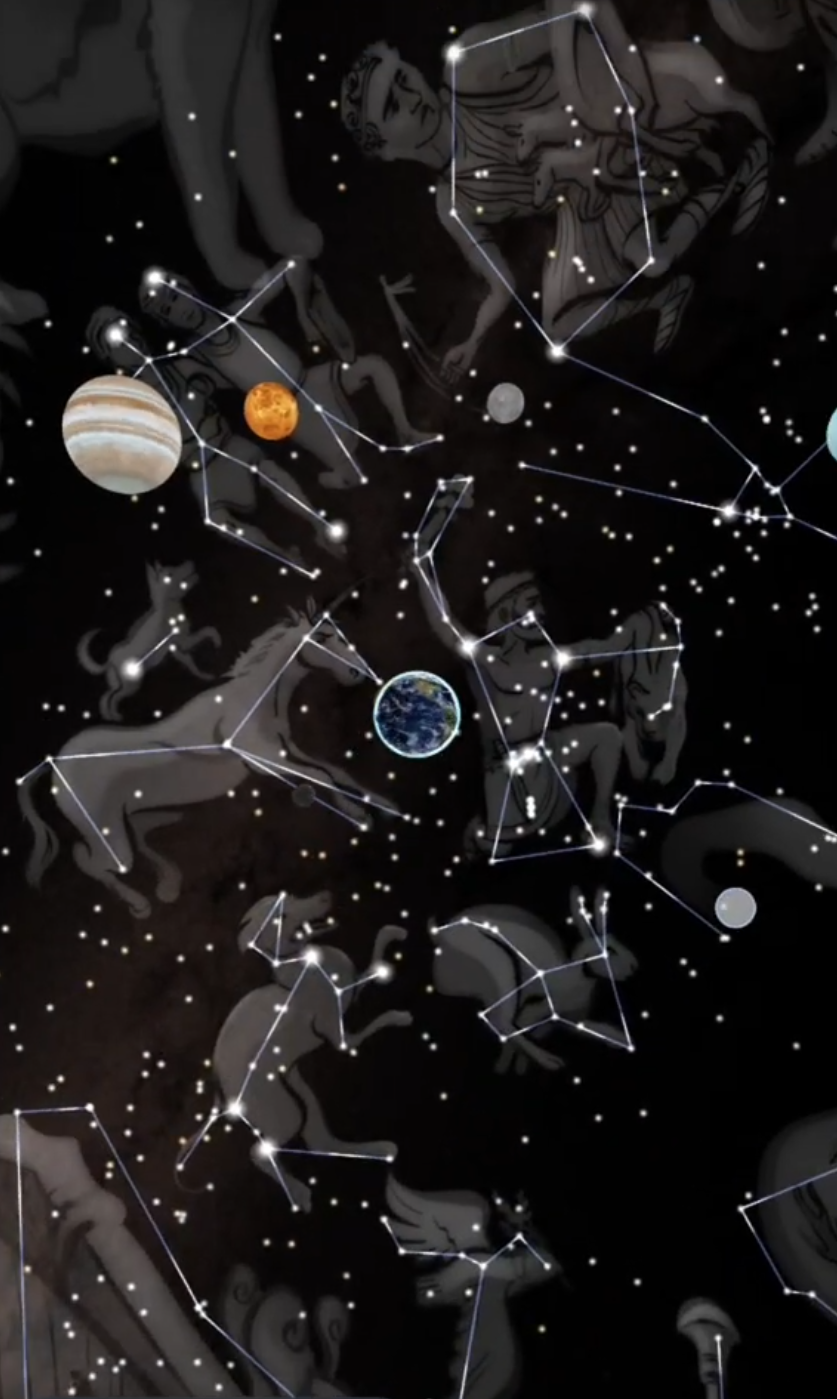
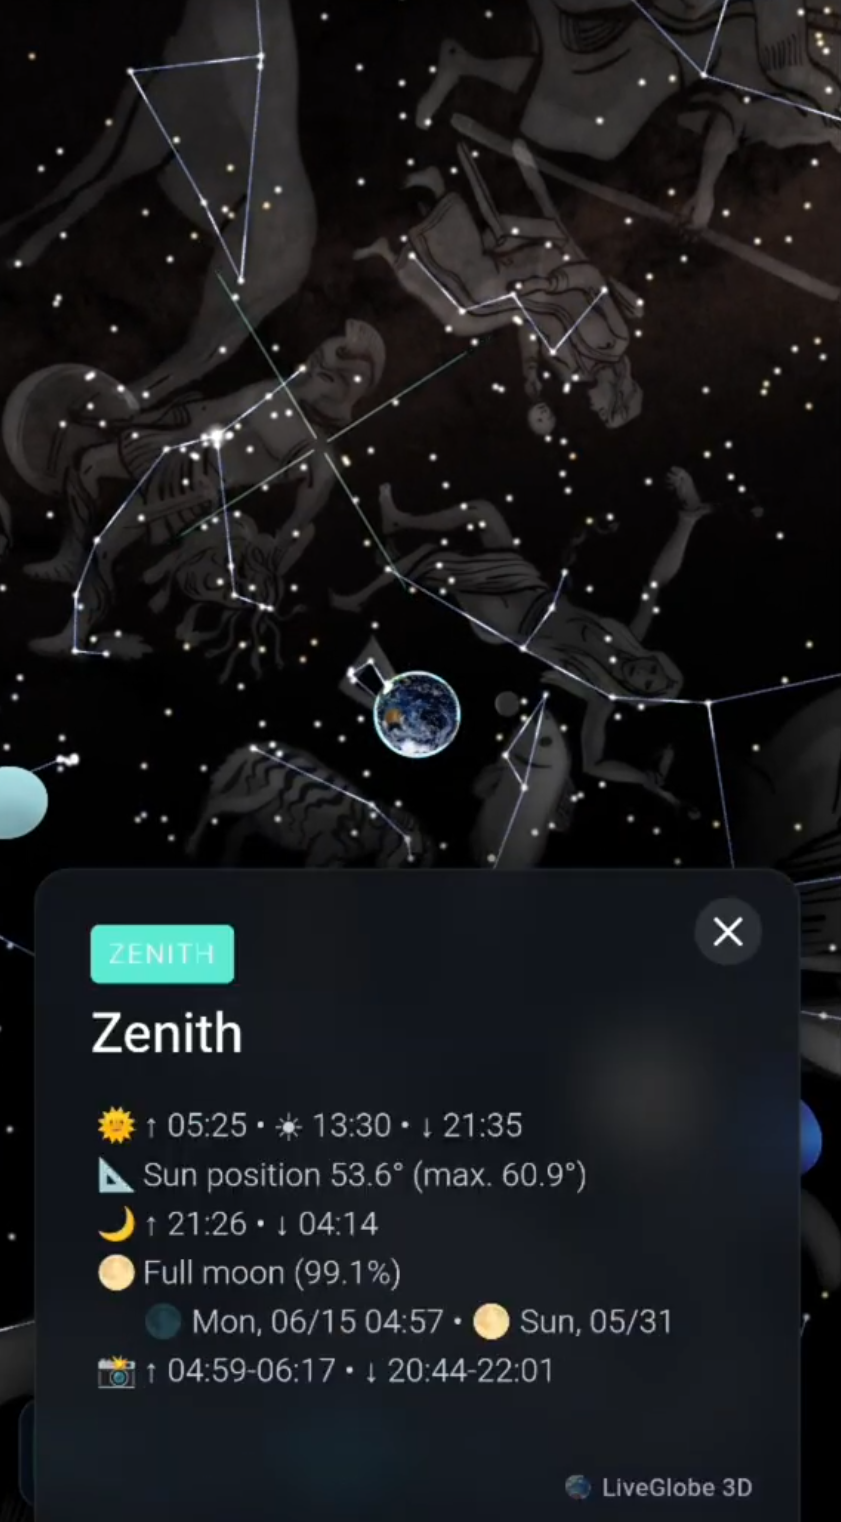
Climate becomes easier to understand when it has shape. Temperatures, oceans, wind, daylight and magnetic fields are connected, yet flat maps often split them into separate views. LiveGlobe 3D brings those environmental layers onto an interactive 3D relief globe.
That makes Earth feel less like a diagram and more like a living system. You can rotate the planet, compare regions and see how data layers sit on continents, oceans, atmosphere and light.
Climate and Environment Layers in Context
LiveGlobe 3D combines several environmental perspectives: a global climate heatmap, sea surface temperatures, wind, clouds, thunderstorms, day and night, and Earth’s magnetic field. Each layer is useful on its own, but the real value comes from seeing them together.
On a 3D globe, you can notice how oceans shape temperature patterns, how daylight moves across the planet, and why climate is never only local. The curved Earth gives scale and context to every layer.
Climate Heatmap: Patterns You Can Read Visually
A climate heatmap turns abstract data into visible patterns. Instead of scanning numbers, you can compare warmer and cooler regions directly on the globe. This is helpful for learning, teaching, presentations and simple curiosity.
With LiveGlobe 3D, those patterns appear next to terrain, latitude and ocean basins. That context matters: climate is not just color on a map, but a relationship between land, water, sunlight and atmosphere.
Ocean Temperatures and Atmospheric Clues
Oceans store and move heat across the planet. Sea surface temperature layers help show why some regions feel dynamic and why ocean patterns matter for weather and climate.
LiveGlobe 3D can pair ocean temperatures with clouds, storms and wind visualization. Instead of looking at one weather point, you get a broad view of how air, water and light interact across the globe.
Earth’s Magnetic Field, Daylight and Orientation
The environment does not stop at the surface. LiveGlobe 3D also visualizes Earth’s magnetic field, turning an invisible physical structure into arcs and lines around the planet.
The day and night view adds another orientation layer. Sun direction, night lights and atmosphere glow help you understand where the planet is waking, cooling, brightening or turning into darkness.
Why a 3D Globe Makes Environmental Data Feel Clearer
Environmental information is complex because it crosses scales. A single place has weather, a coastline has ocean influence, a hemisphere has seasons, and Earth has atmosphere, light and magnetism.
An interactive globe keeps those scales connected. Rotate, zoom, compare and switch layers without losing the planet as a whole. LiveGlobe 3D turns environmental data into something you can explore calmly and visually.
Conclusion: Explore Earth as a Connected System
Climate and environment layers show that Earth is not a collection of isolated places. It is a connected system of light, air, water, temperature, magnetism and motion.
To explore those relationships yourself, open the LiveGlobe 3D homepage and try the environmental layers directly on the globe.