How to read a lightning map: dots, colors and data times
Read a live lightning map: understand detections, check its legend and time window, and distinguish observed storm development from a forecast.
Dots light up on a lightning map, fade and form new clusters. Start with the legend, data time and display window before interpreting the storm. A dot represents a discharge detected and displayed by that particular system—not automatically a confirmed strike on a particular building.
An external service such as Blitzortung.org maps the distribution of detected lightning activity. A simple reading routine helps you identify where discharges were registered recently and how the pattern has changed.
What does a dot represent?
That depends on the product. Some displays show located electrical pulses; others show grouped flashes or counts per unit of area and time. “One dot equals one complete flash” is therefore not a universal rule. A flash can contain multiple component discharges, and products may group them differently.
Lightning is not synonymous with a ground strike. Discharges can occur within clouds, between clouds, or between a cloud and the ground. Check the product description to see whether the map distinguishes these types. The National Weather Service lightning science overview provides background on the different processes.
How do detections reach the map?
In a ground-based network, several stations receive electromagnetic signals from a discharge. Its location is calculated using their arrival times and the known station positions. Blitzortung.org explains this method for its VLF network. Signals still need to be transmitted, processed and displayed, so a live map is not an instantaneous view.
Optical instruments in space use a different approach. NOAA’s Geostationary Lightning Mapper detects brief light signals, including lightning within clouds. This illustrates another measurement method; it does not mean GOES data cover every region on Earth. Different sensors and processing methods need not produce matching sets of dots.
A five-step map-reading routine
- Check the source and product. Are you looking at individual detections, grouped flashes or density values? Does the selected product cover your region?
- Read the legend. Colors may indicate detection age. In other products they represent frequency or another quantity. Red does not universally mean stronger or more dangerous.
- Check the data time and time zone. UTC is not necessarily your local time. Separate the measurement time from the website’s last refresh.
- Note the display window. Does it cover a few minutes or a longer period? A longer window accumulates older activity and can make the current situation look busier.
- Compare successive views. Keep the source, map area and window length unchanged. Look for new clusters rather than merely following dots that remain on screen.
You do not need to memorize a color scheme. You need to check what each service’s own legend says.
Example: observed movement is not a forecast
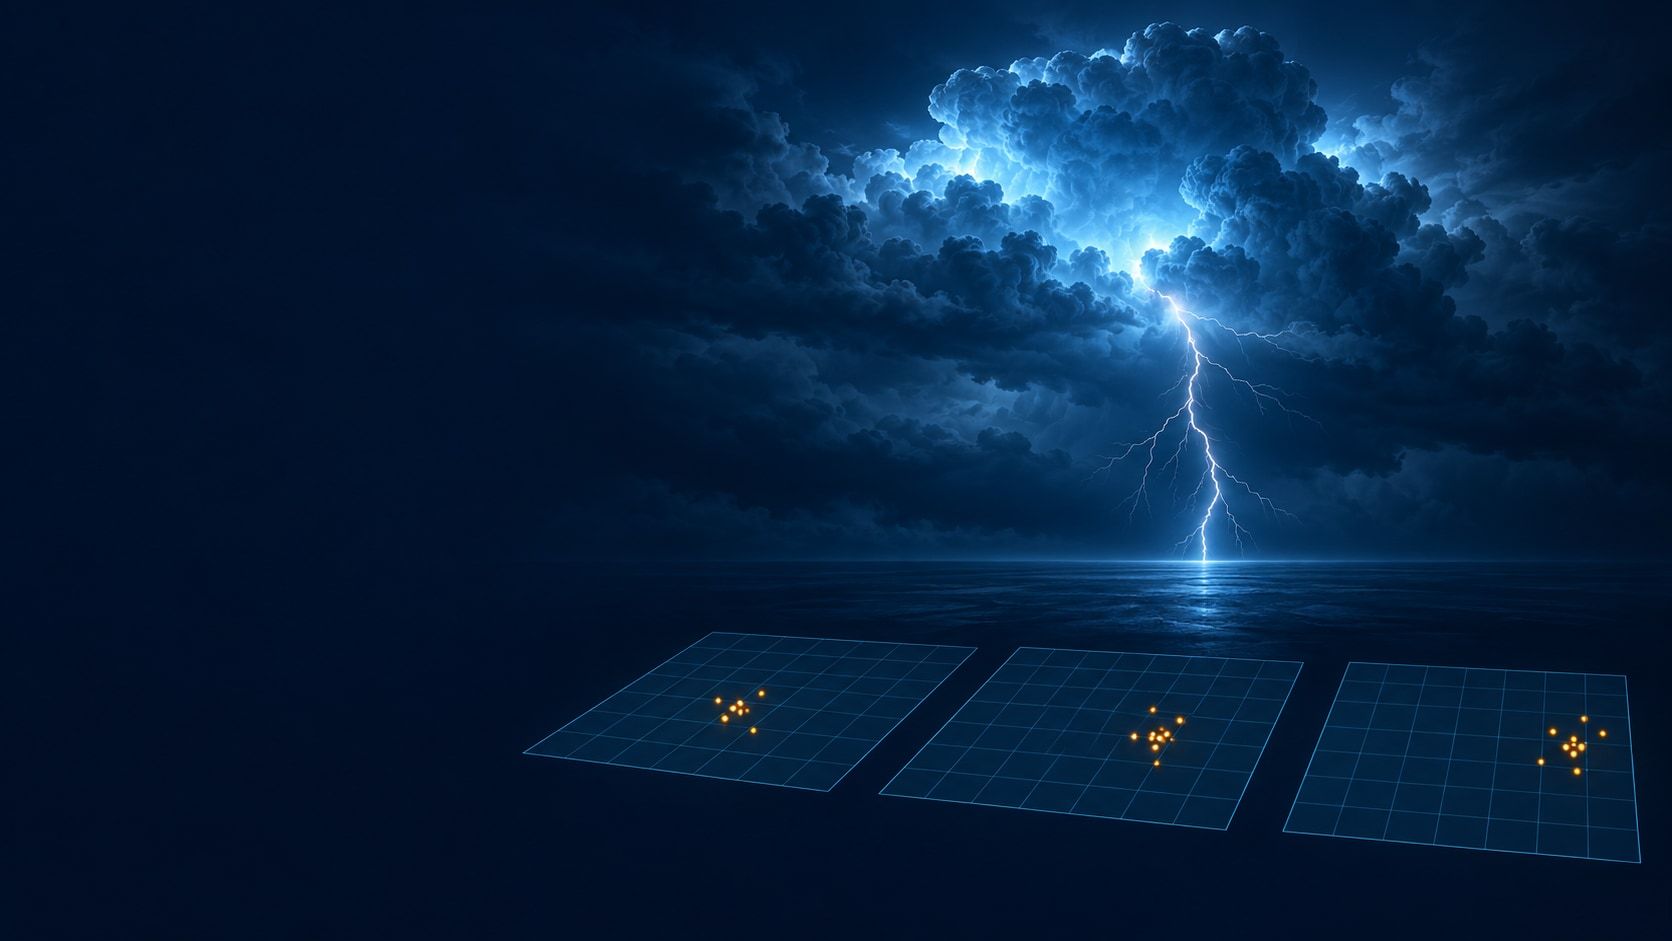
Imagine three fictional views from the same source, each showing a ten-minute window:
| View time | Displayed period | Example observation |
|---|---|---|
| 14:00 UTC | 13:50–14:00 UTC | A cluster lies west of a town. |
| 14:10 UTC | 14:00–14:10 UTC | New detections appear closer to its western edge. |
| 14:20 UTC | 14:10–14:20 UTC | The concentration of new detections is farther east. |
The supported conclusion is: Detected lightning activity shifted east during this period. That does not give a reliable arrival time at your location. Storm cells can develop, weaken or merge. These dots are recorded discharges, not the track of a single moving object.
Why more dots do not automatically mean greater danger
A hundred dots over an hour and twenty over five minutes are not directly comparable measures of intensity. Map area, coverage and counting method also matter. A dense cluster alone does not tell you how much rain, hail or wind will reach a particular place.
Conversely, a blank map might reflect no detected activity, a time filter or a data gap. Use official weather warnings and conditions around you for outdoor decisions. If you hear thunder, move into a substantial building or an enclosed, metal-topped vehicle. The NWS recommends staying sheltered for at least 30 minutes after the last thunder. Do not wait for a nearby dot to appear.
Explore the wider weather setting on a globe
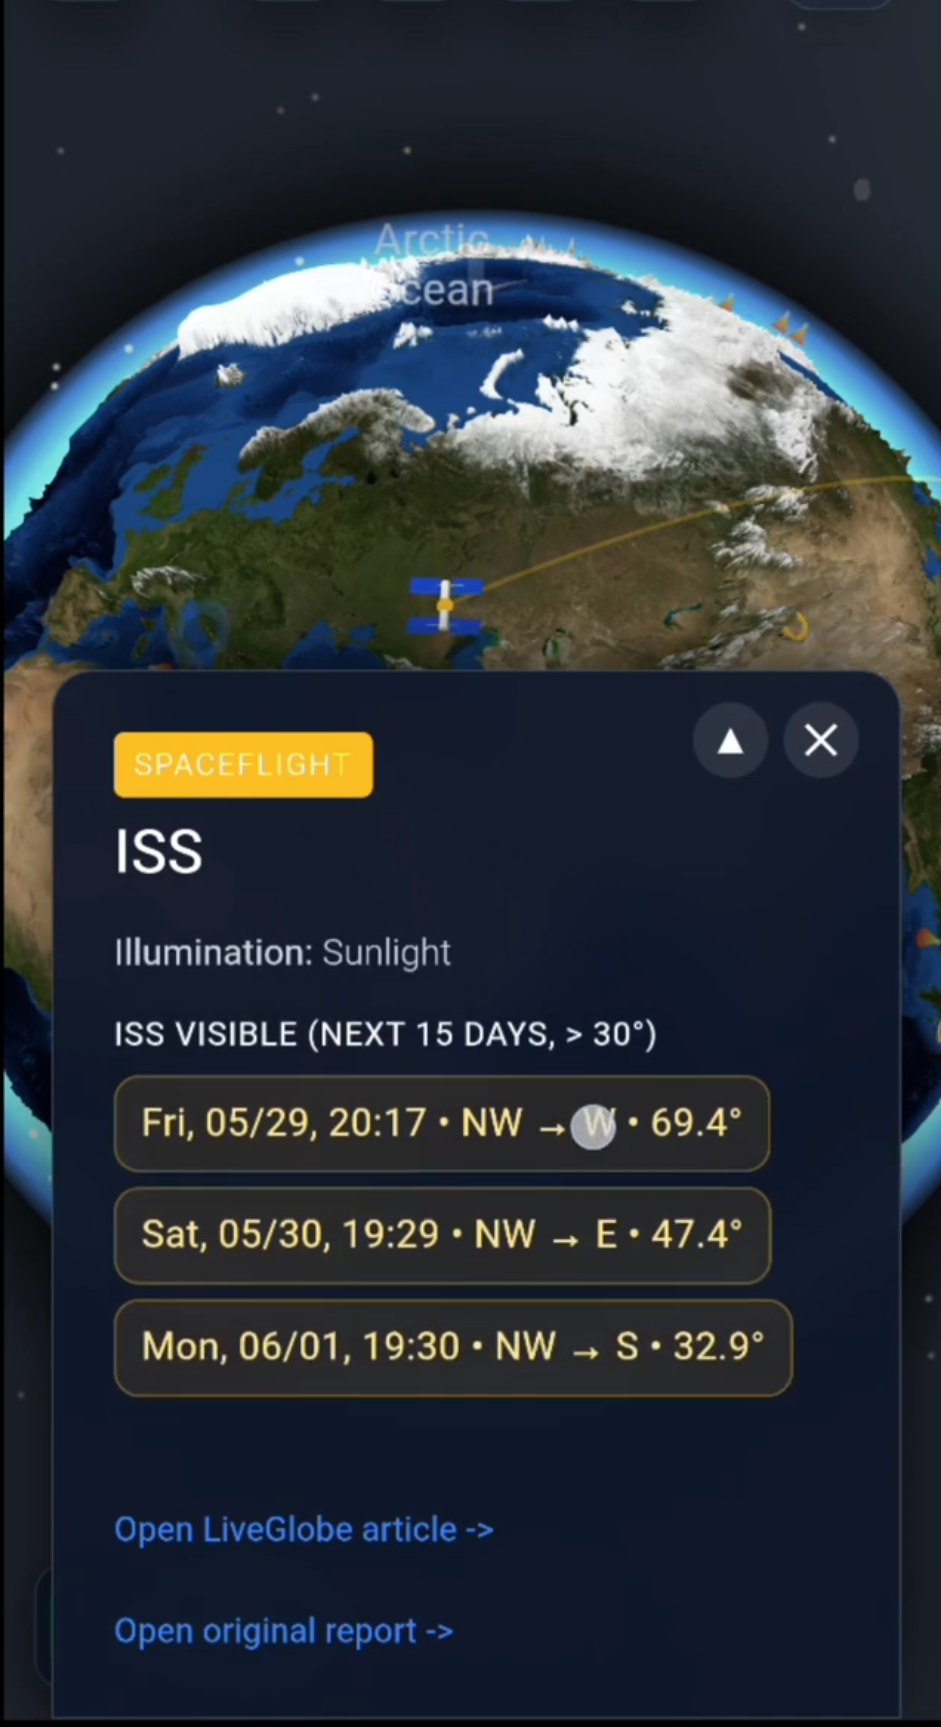
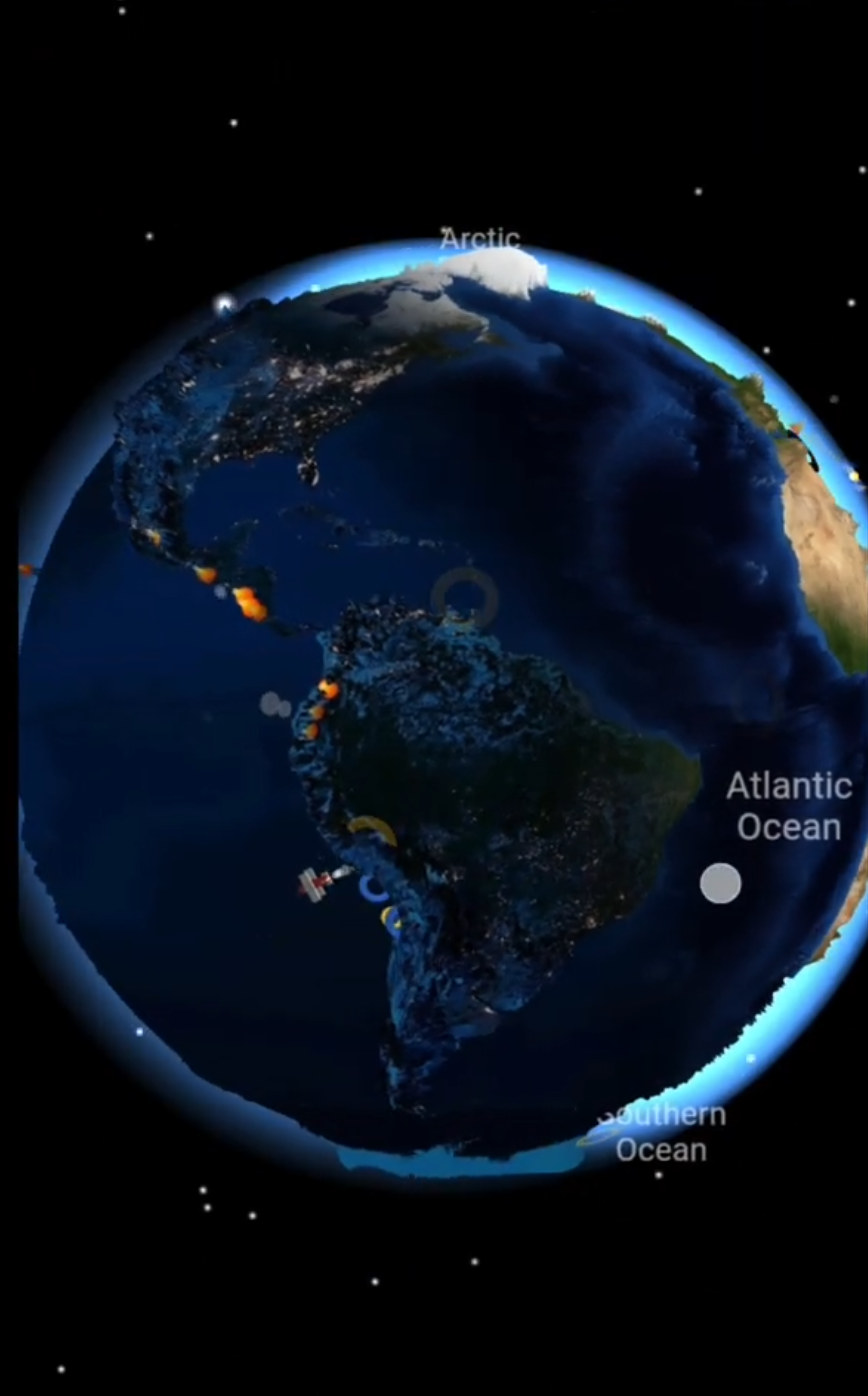
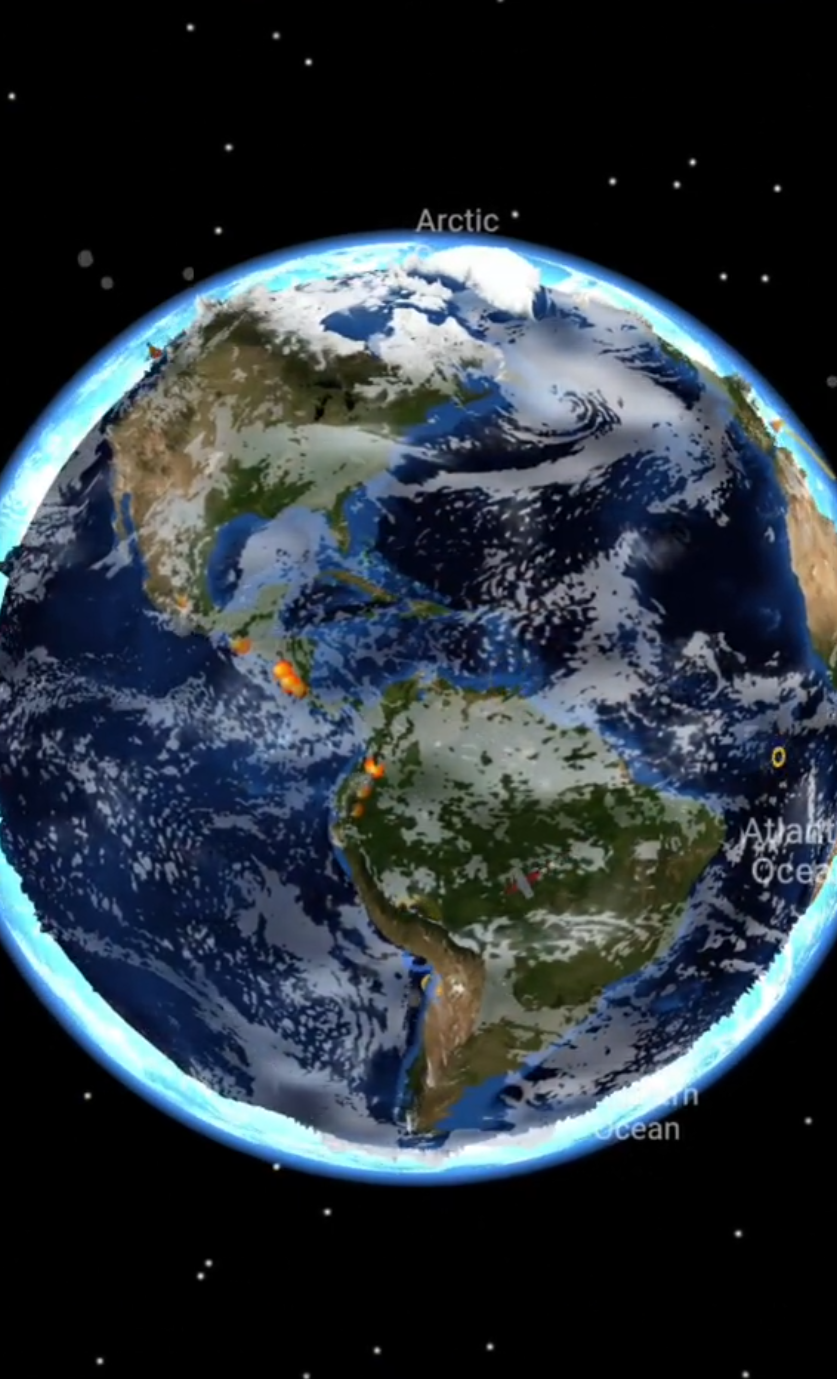
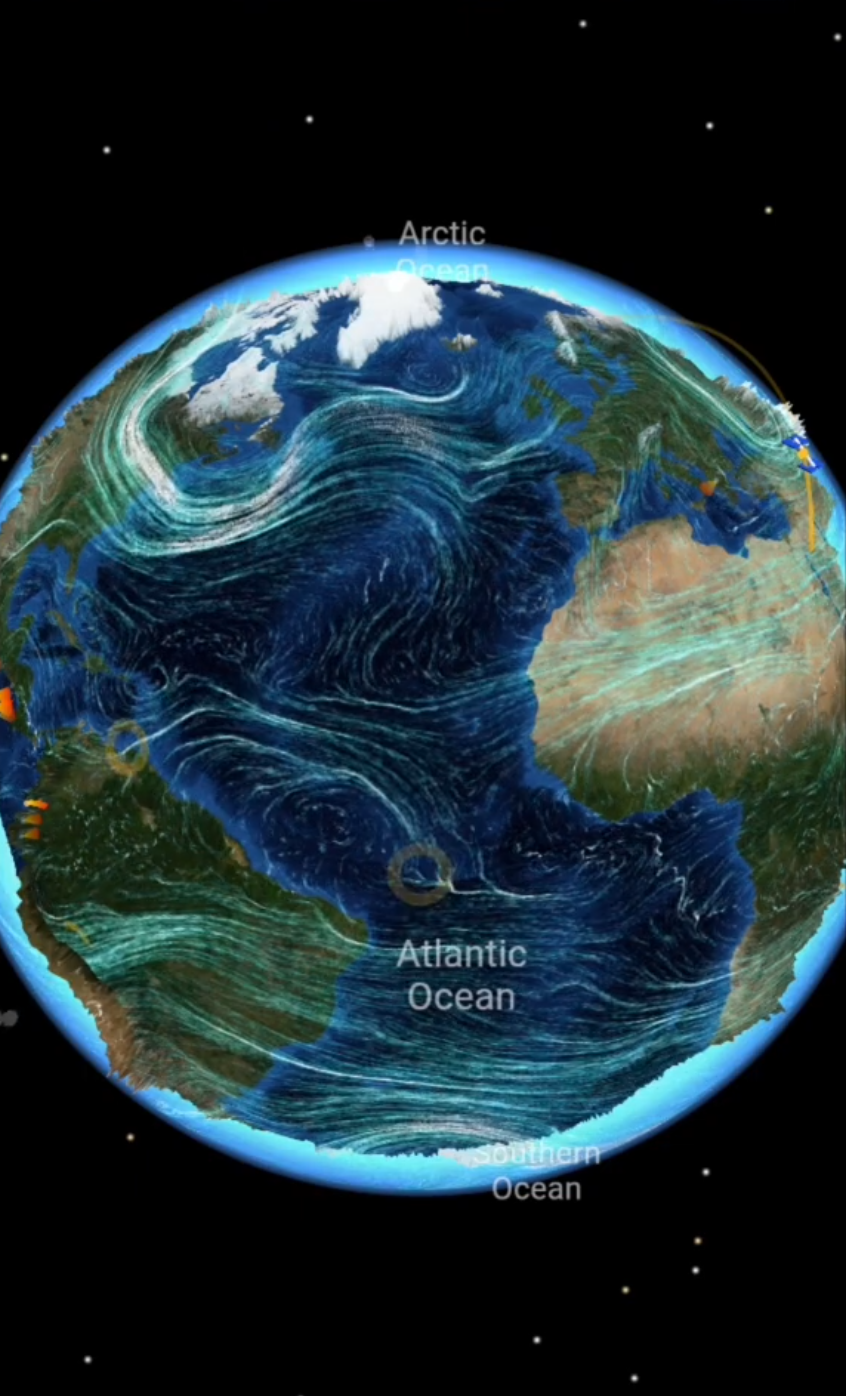
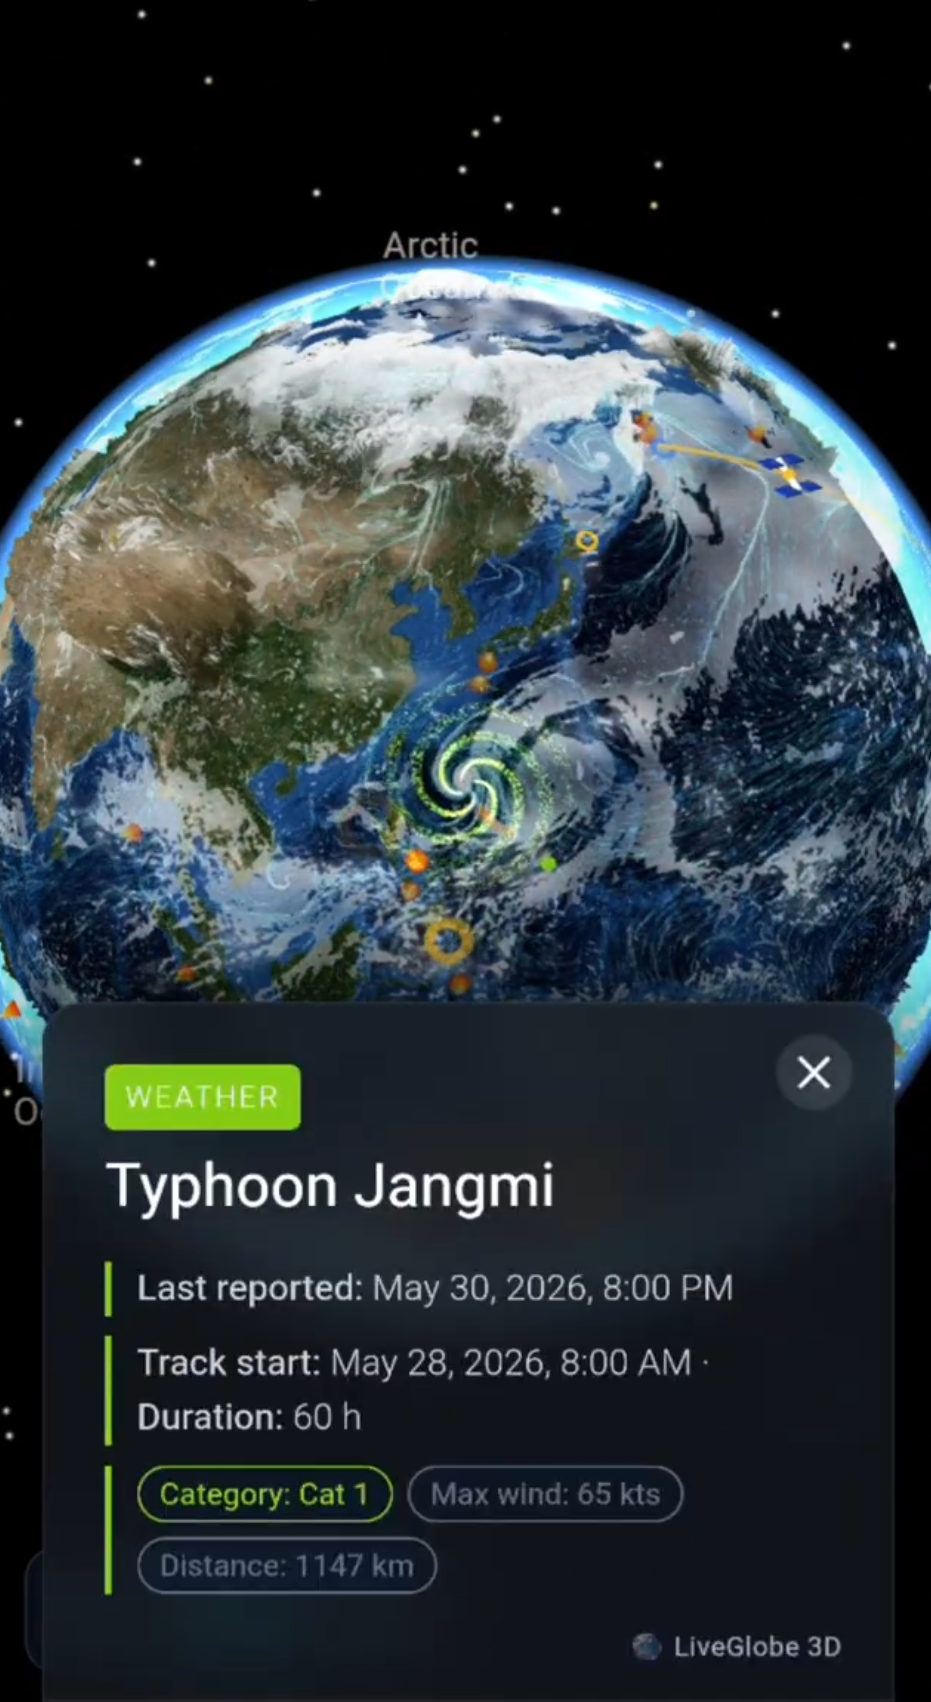
In LiveGlobe 3D, rotate and zoom the globe and select available cloud or wind views in the Live menu. Compare the region with your external lightning map, checking each source’s data times. Web access requires sign-in; relevant layers may require premium access and available external data.
Cloud and wind views add weather context rather than replacing lightning detection. For a broader comparison method, see reading a Europe weather map. For the audible side of a storm, explore the delay between lightning and thunder. Use the available globe views to place your local map in its wider geographical setting.
Common questions
Is a lightning map the same as rain radar?
No. Lightning detection describes electrical activity. Radar products and cloud imagery measure other aspects of weather. They can complement one another without measuring the same thing.
Does a dot mark the exact impact location?
Not as a general rule. First establish the discharge type and data product. A symbol displayed at street level does not by itself establish that a particular building was struck.
Can I identify a direction of travel?
You can describe changes in the distribution of detected activity across comparable views. That is an observation of what has happened, not a guaranteed forecast of the next flash.
Short clips
The app in motion: short, genuine glimpses straight from use.
At a glance
How the app feels on your phone.