What causes ocean currents? Wind, Earth's rotation and water density explained
Discover how wind, Earth's rotation and water density shape ocean currents, with Gulf Stream and upwelling examples and four questions for reading a map.
The ocean does more than send waves onto a beach. Huge volumes of water move across entire basins, while other water sinks or rises from below. Wind drives many surface currents; differences in water density contribute to circulation at depth. Earth’s rotation, coastlines and the seafloor shape their paths.
An ocean current is a directed movement of water. It carries heat, salt and nutrients, among other things. Two questions make the subject easier to understand: what gets the water moving, and what determines where it goes?
Wind transfers motion to the sea
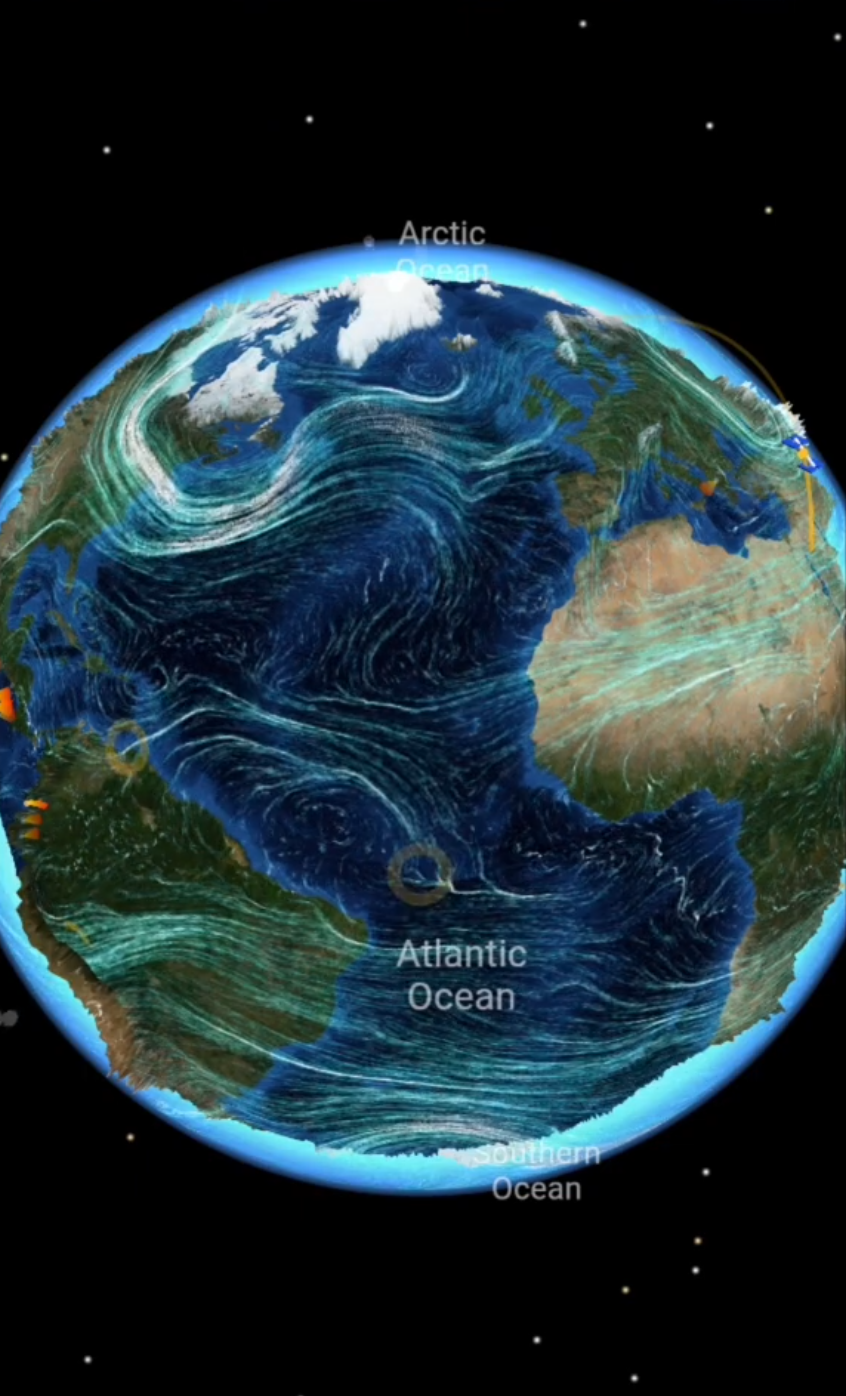
Wind blowing over the sea transfers some of its motion to the water through friction. Persistent wind systems, including the trade winds and westerlies, therefore help drive large-scale surface currents. NOAA’s overview of ocean currents distinguishes wind-driven movement from circulation influenced by density differences.
Water does not simply follow every wind arrow. Earth’s rotation deflects moving water, and pressure differences within the ocean also affect its motion. Direction and speed can change with depth. A wind map alone cannot explain a complete ocean-current map.
Waves and currents are different, too. A wave can transmit energy while the water mainly oscillates. A current describes directed water transport over the period being considered. Both can occur in the same place.
Rotation and continents shape ocean gyres
The Coriolis effect deflects large-scale moving water to the right in the Northern Hemisphere and to the left in the Southern Hemisphere, relative to its direction of travel. It changes the path rather than supplying the energy that drives the flow. The same principle helps explain why highs and lows rotate.
Continents bound the ocean basins. Together with prevailing winds and Earth’s rotation, they help produce large subtropical circulation patterns called gyres. Viewed from above, the North Atlantic subtropical gyre turns clockwise, while its South Atlantic counterpart turns counterclockwise. This does not mean that every current in a hemisphere turns the same way. Equatorial, polar and coastal flows have other patterns.
NOAA’s lesson on boundary currents describes these gyres and the currents along their edges. An arrow on a world map summarizes a broad, variable flow, rather than marking a permanent channel with fixed banks.
Temperature and salinity change water density
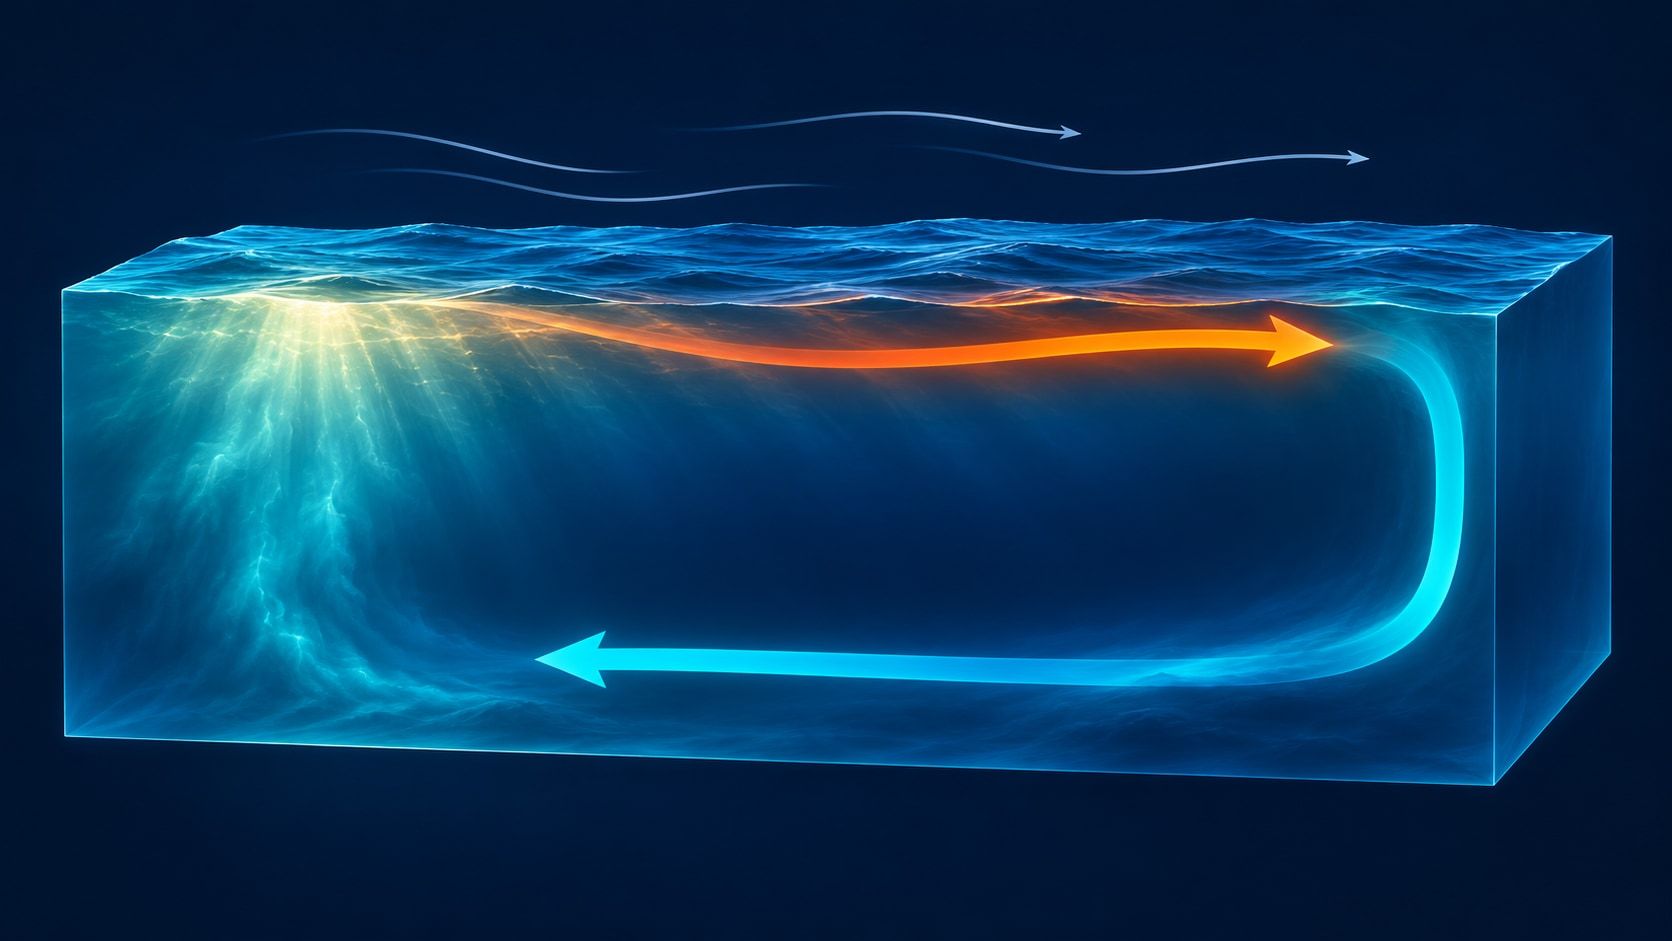
Seawater does not have the same density everywhere. Under comparable conditions, colder seawater is denser than warmer seawater, and saltier water is denser than fresher water. Surface water can sink when it becomes sufficiently dense compared with the water below.
In the far north, the ocean can lose heat to the atmosphere. When sea ice forms, much of the salt remains in the surrounding water. Cooling and increasing salinity can raise its density together. NOAA calls this thermohaline circulation: “thermo” refers to temperature and “haline” to salt.
The familiar global conveyor-belt picture is a simplification. The ocean is not a single closed pipe. Wind, mixing, basin shape and density all interact, connecting surface and deep currents.
Two examples: the Gulf Stream and upwelling
The Gulf Stream is a strong, warm current along the western boundary of the North Atlantic, following the eastern coast of North America. It transports heat northward. As part of the wider Atlantic circulation, it shows how currents redistribute energy as well as water. Western Europe’s climate, however, cannot be explained by one current arrow alone.
Upwelling brings water from deeper layers toward the surface. If wind-driven transport moves surface water away from a coast, colder water can rise to replace it. This water is often rich in nutrients, supporting biological production. NOAA gives the western coasts of South America and Africa as examples.
This article’s illustration is a conceptual section showing flow at different depths and sinking water. It is not a map of the Gulf Stream or an exact depiction of one real circulation loop.
Read a current map in four steps
| Question | Why it matters |
|---|---|
| What depth does it show? | Surface water may move differently from water below it. |
| What do the arrows and colors mean? | Color may represent temperature or speed; check the legend. |
| What period does it represent? | A long-term average is not a snapshot. |
| Where do the data come from? | Measurements, models and simplified diagrams serve different purposes. |
A temperature map might reveal a ribbon of warm water, for example. One temperature color does not establish a unique flow direction. Tides can also create periodically reversing currents, especially near coasts: another driver alongside wind and density.
Put the geography together on a globe
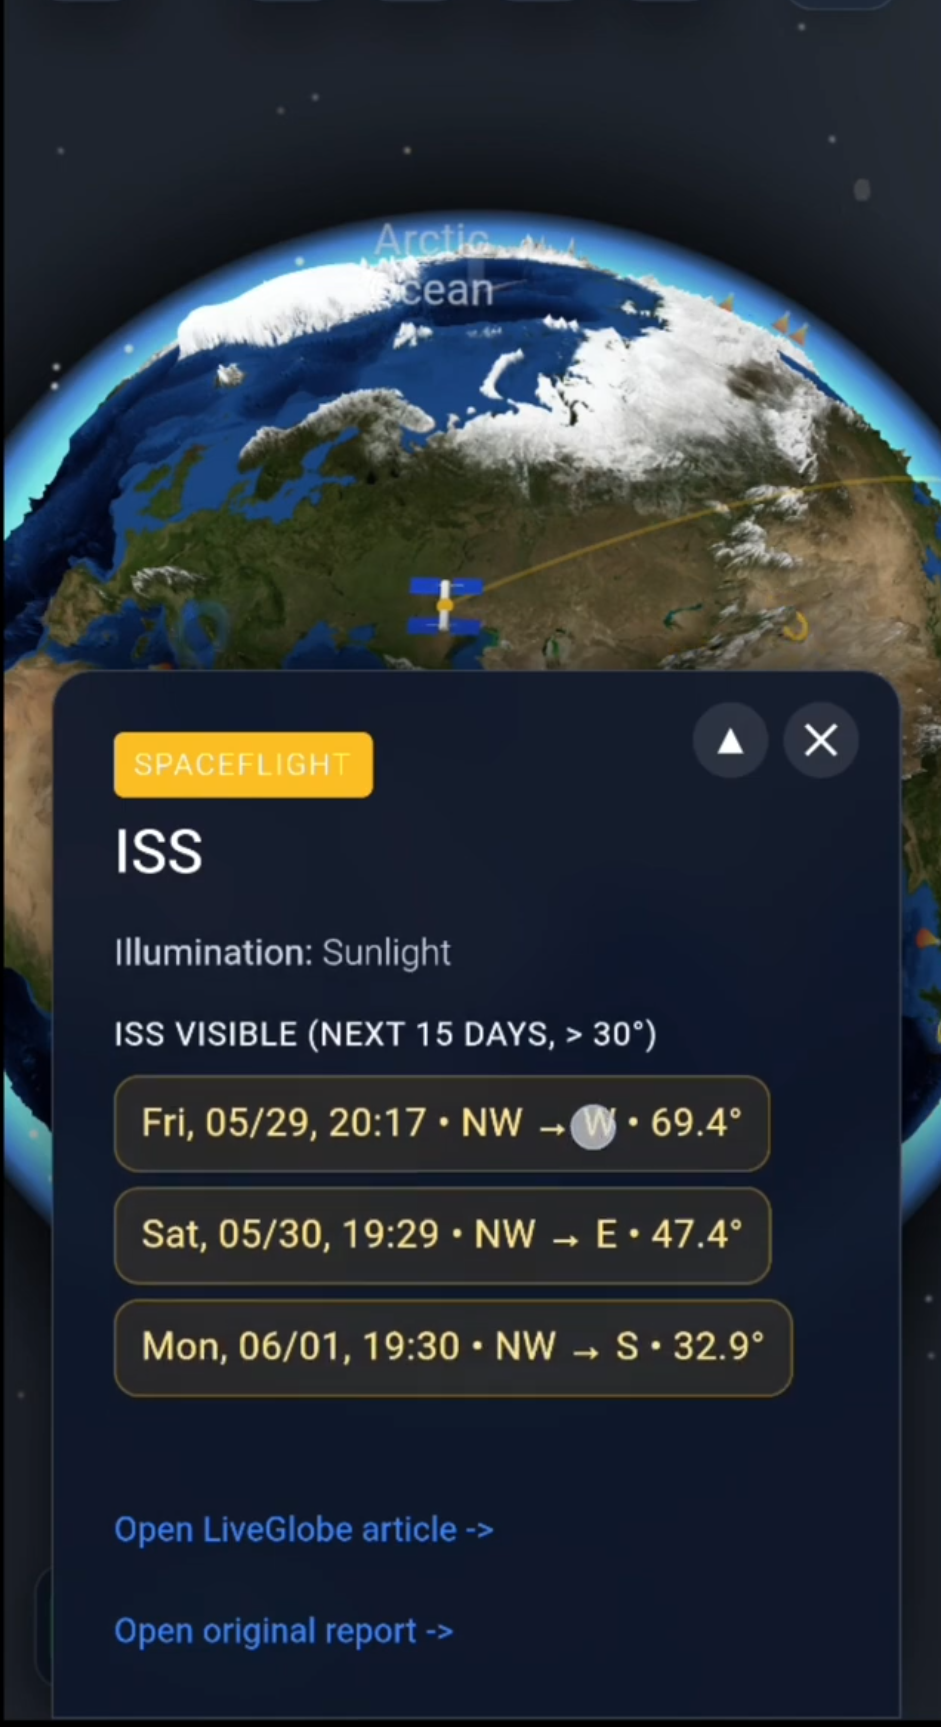
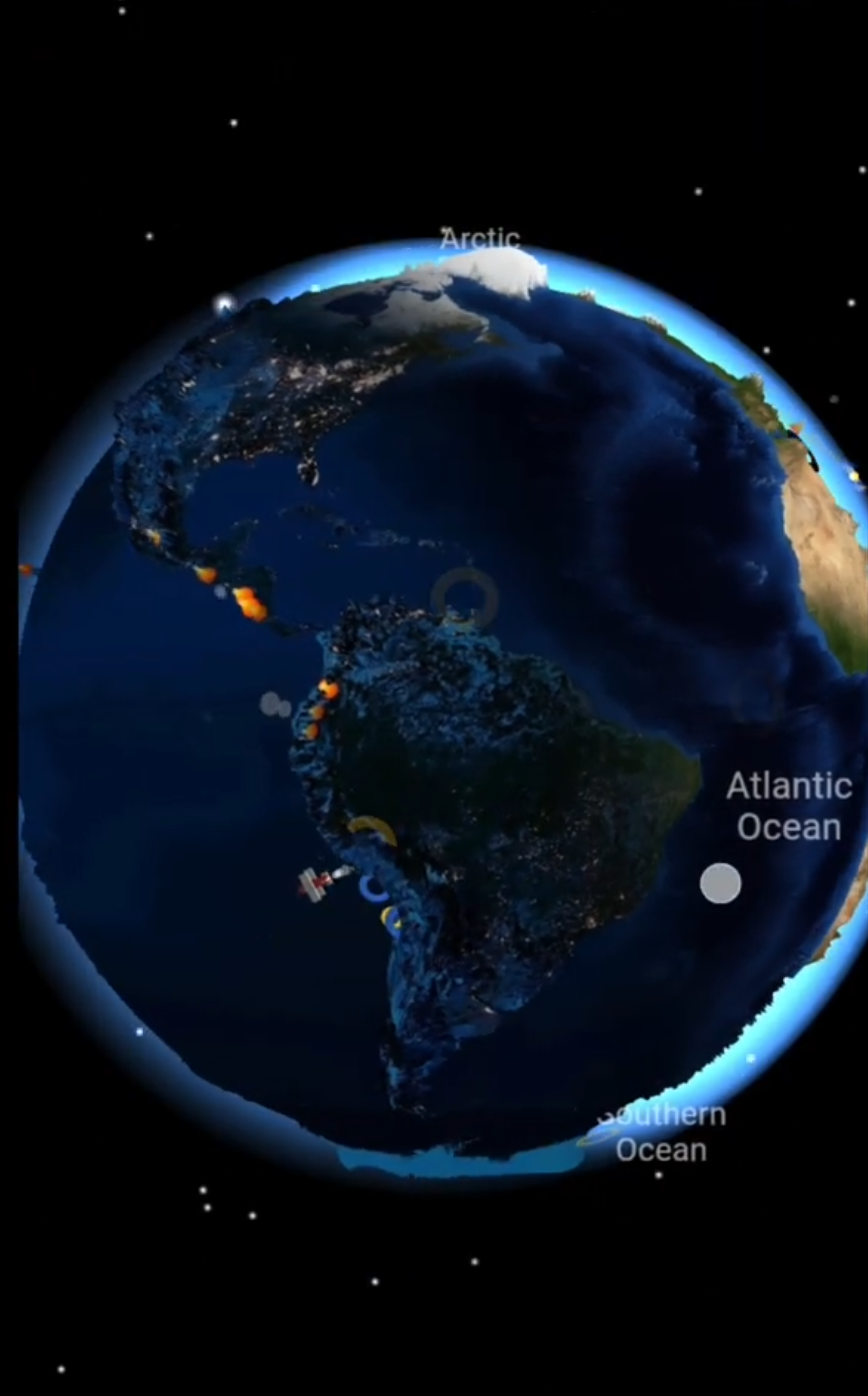
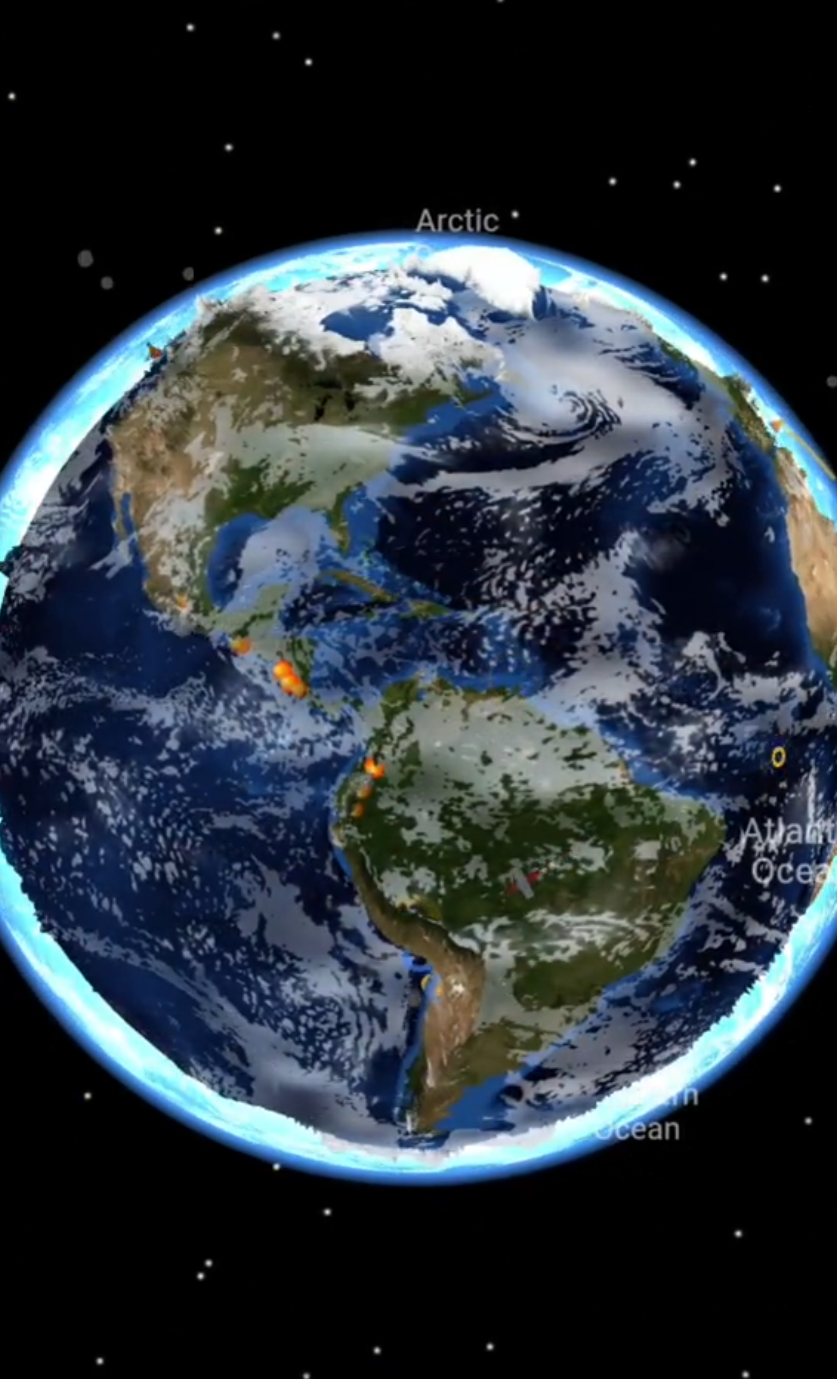
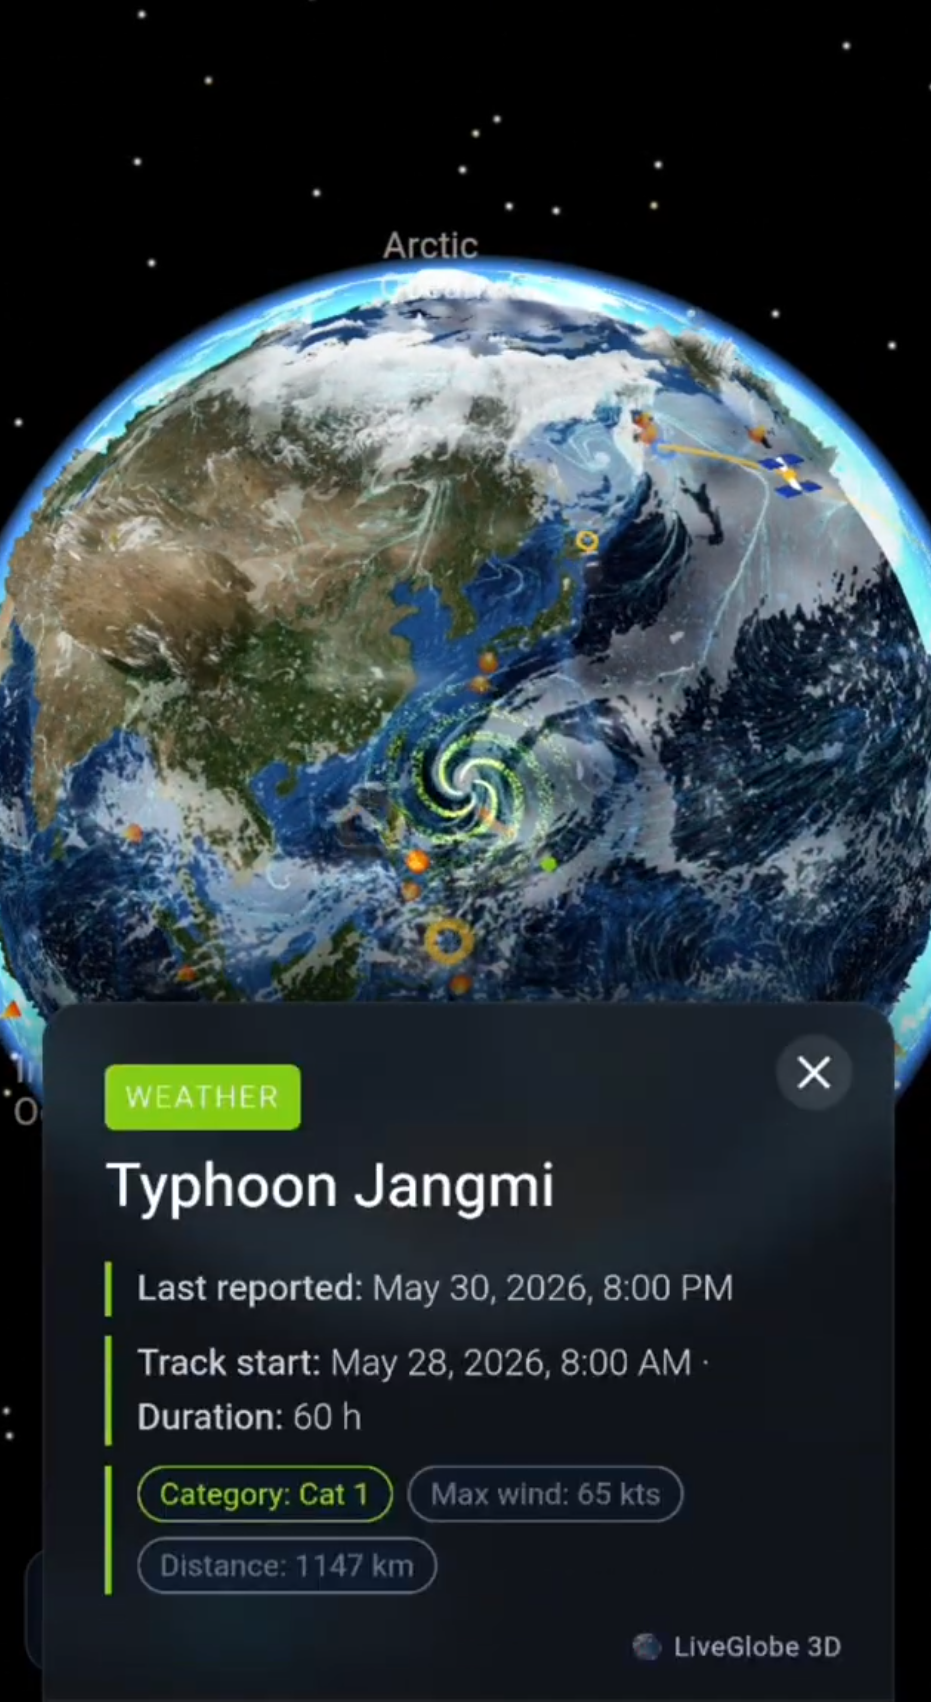
In LiveGlobe 3D, search for Florida, then rotate the globe to see the North Atlantic between North America and Europe. Next, compare the western coast of South America. Rotating, zooming and searching for places help connect basins and coastlines spatially. Web access requires sign-in, and place search relies on external data.
Compare that geographical overview with a scientific current map and its legend. Wind and density help set water in motion; rotation and basin shape help explain its winding paths. Keeping those roles separate makes the arrows much easier to understand.
Short clips
The app in motion: short, genuine glimpses straight from use.
At a glance
How the app feels on your phone.