Why do highs and lows rotate? Air pressure and the Coriolis effect explained
Understand pressure gradients, the Coriolis effect, and surface friction: why highs and lows rotate differently and how to read the pattern on a weather chart.
On a wind map, air often appears to circle invisible centers. Why take that roundabout route instead of moving straight from high pressure to low pressure? Pressure differences drive the air, Earth’s rotation deflects its motion, and friction near the ground changes its path.
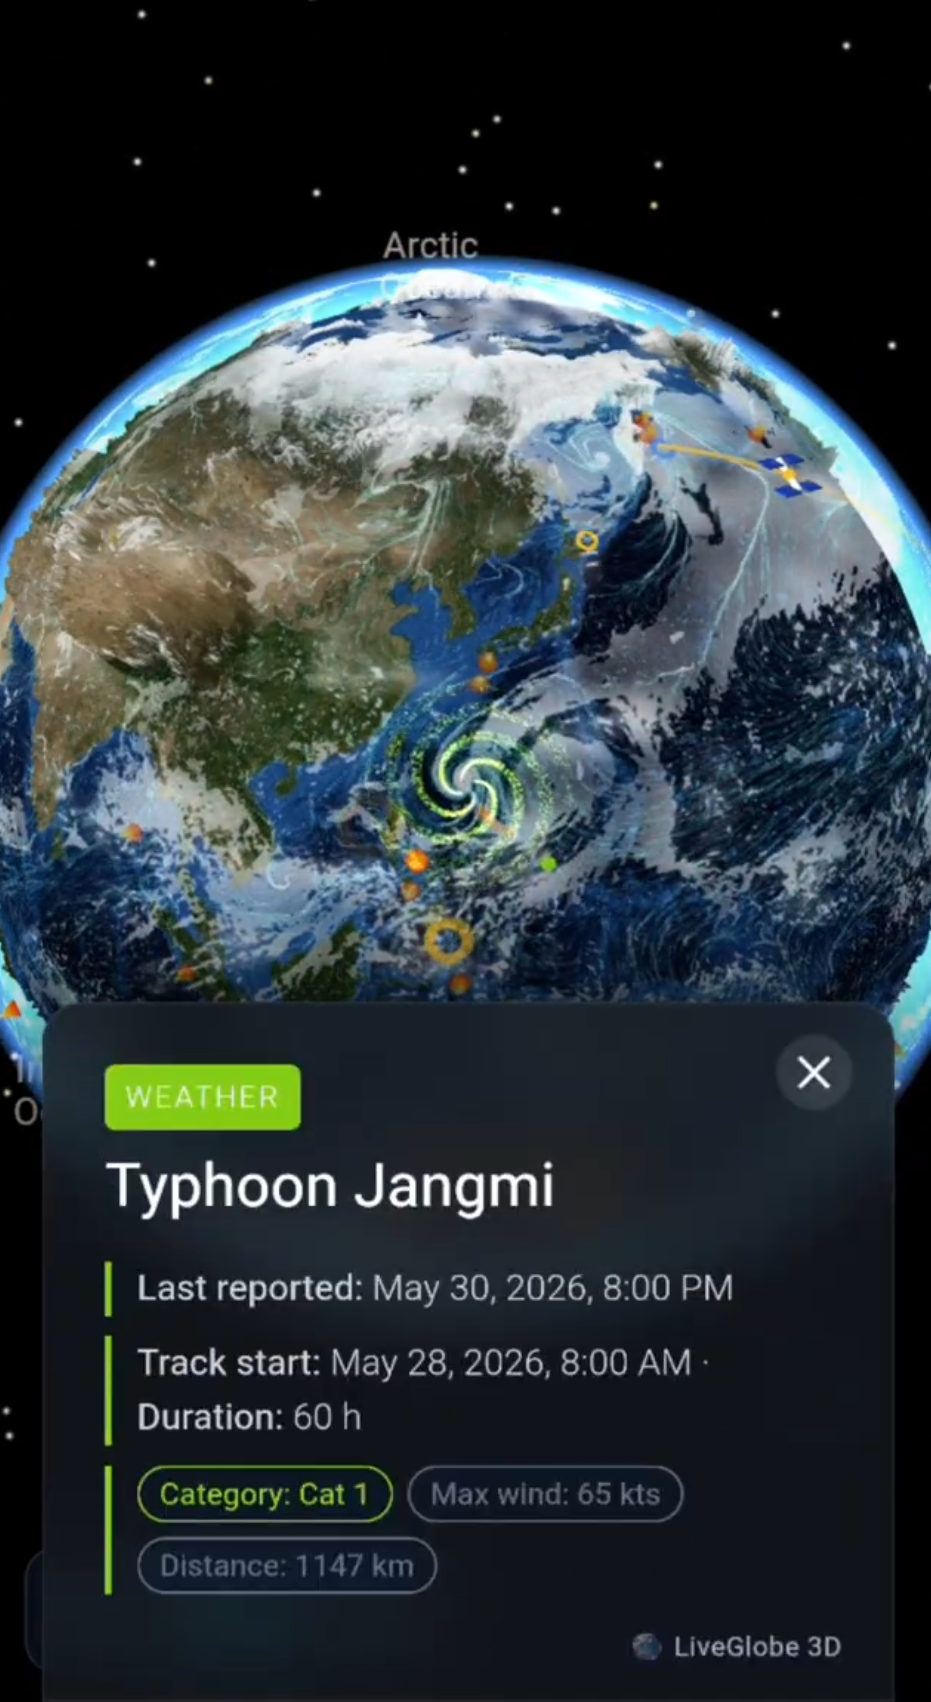
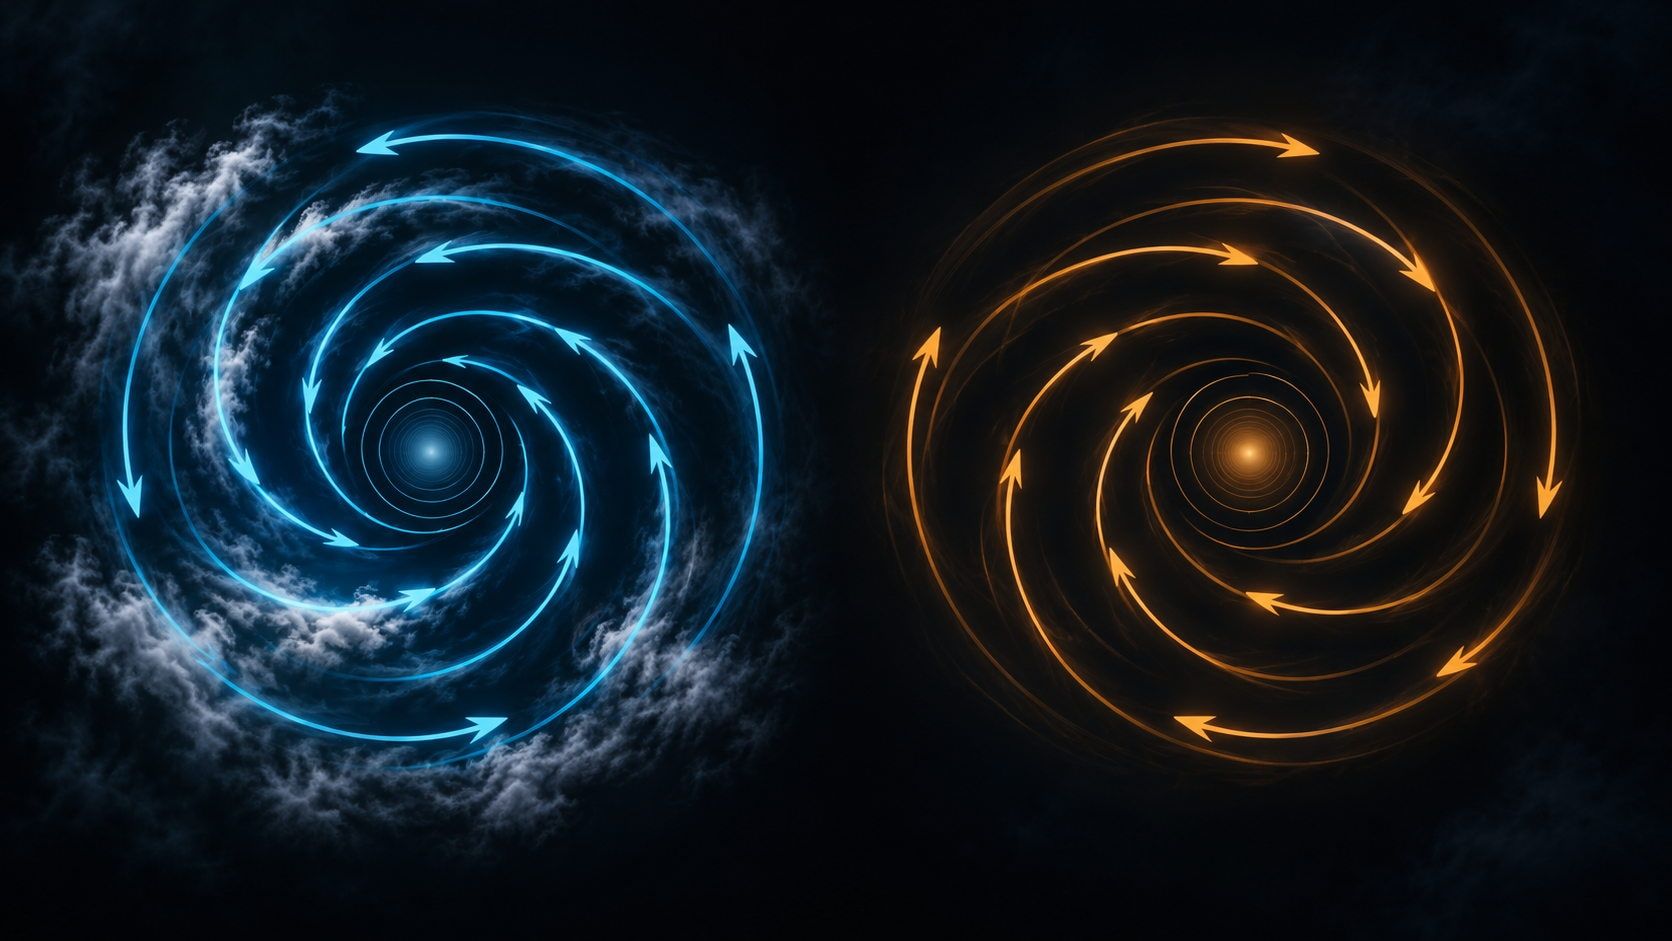
These three pieces explain the typical circulation around large-scale weather systems. In the Northern Hemisphere, air circulates counterclockwise around a low and clockwise around a high. In the Southern Hemisphere, the directions reverse. In every case, we mean the circulation viewed from above the pressure system.
A high is a pressure maximum; a low is a minimum
Air pressure is the force the atmosphere exerts per unit area. Weather maps commonly show it in hectopascals, or hPa. Highs and lows are defined relative to their surroundings: pressure is higher at a high’s center than around it, and lower at a low’s center. A single pressure reading without that comparison cannot tell the whole story.
The lines on a conventional surface weather chart are isobars. They connect places with equal pressure, typically using values adjusted to sea level. If the labeled values increase toward the center, you have a high; if they decrease, you have a low (Met Office: high and low pressure).
The center is not a solid object. Saying “a low rotates” is shorthand for the circulation around its pressure minimum. That circulation and the movement of the whole system across a map are different things.
Pressure differences set air in motion
The pressure gradient force acts from higher toward lower pressure. If it were the only force involved, air would accelerate straight across the isobars toward lower pressure.
Distance matters as well as the pressure difference. A 10 hPa change over a short distance creates a stronger gradient than the same change over a much longer distance. Closely spaced isobars therefore suggest stronger winds, provided the map scale and pressure intervals are comparable.
Their spacing alone does not give an exact wind speed at a particular location. Friction and terrain also affect the result. NOAA’s explanation of wind brings the pressure gradient, rotation, and friction together.
The Coriolis effect deflects moving air
Earth rotates. From our viewpoint on its rotating surface, moving air experiences the sideways deflection described by the Coriolis effect:
- To the right of its direction of travel in the Northern Hemisphere.
- To the left of its direction of travel in the Southern Hemisphere.
“Right” does not always mean east. For northward-moving air, right is east; for southward-moving air, right is west. Imagine following the air rather than fixing your viewpoint to the screen (NOAA: the Coriolis effect).
The Coriolis effect is not the initial push supplied by the pressure gradient. It changes the direction of air that is already moving. In a simplified situation without strong surface friction, the pressure gradient and Coriolis deflection can balance so that wind flows approximately parallel to straight isobars. Curved paths involve a more complex force balance. The useful starting point is that a pressure gradient does not require a straight path into the low.
Why surface air still flows into a low
Near the ground, friction slows the wind and changes the balance of forces. Air follows the isobars less closely and gains a component across them.
Surface air spirals inward toward a low and outward from a high. Around a low, air converges and rises. Around a high, air sinks from above and spreads outward near the surface. Friction is therefore a key difference between an idealized flow aloft and a surface weather chart.
Think of neither system as a rigid spinning disk or as a set of straight air paths. Typical circulation combines rotation with inward or outward movement.
Rotation in both hemispheres
This table describes typical large-scale circulation viewed from above. The inward and outward components refer to near-surface flow.
| Pressure system | Northern Hemisphere | Southern Hemisphere | Surface component |
|---|---|---|---|
| Low | Counterclockwise | Clockwise | Toward the center |
| High | Clockwise | Counterclockwise | Away from the center |
For the United States or Europe, remember low counterclockwise, high clockwise. For Australia or southern South America, reverse the rotation. This is a large-scale weather rule, not an explanation for every small eddy.
Work through an imaginary weather chart
Picture a north-up surface chart of the North Atlantic. Around a center west of Ireland, values decrease inward from 1010 to 1005 to 1000 hPa. Farther south, another center has values increasing inward from 1015 to 1020 to 1025 hPa. These are invented practice values, not a current weather report.
- Identify the centers. The northern system is a low; the southern one is a high. Follow how the values change toward the middle.
- Check the hemisphere. Both are in the north: expect counterclockwise circulation around the low and clockwise circulation around the high.
- Include surface friction. Sketch a slight inward spiral around the low and an outward spiral around the high, rather than closed circles alone.
- Find a local direction. On the low’s southern side, the circulating component moves roughly eastward. Near the ground, an inward component is added. Rotation and the local wind direction are different pieces of information.
- Compare spacing. At the same scale and with the same 5 hPa intervals, tighter spacing suggests a stronger pressure gradient.
To name the local wind, describe where it comes from: eastward-moving air comes from the west. See why a westerly wind blows east for that distinction.
Does high pressure always mean sunshine?
Not necessarily. Air rising in a low cools. If enough water vapor condenses, clouds and possibly precipitation develop. Sinking air in a high warms, which can encourage clouds to evaporate.
These are common associations, not guarantees. Winter high pressure can bring fog or low cloud, and a low’s area of influence can contain dry periods. The Met Office describes these different weather conditions. Moisture, season, and the particular weather pattern also matter at your location.
Explore the patterns with LiveGlobe 3D
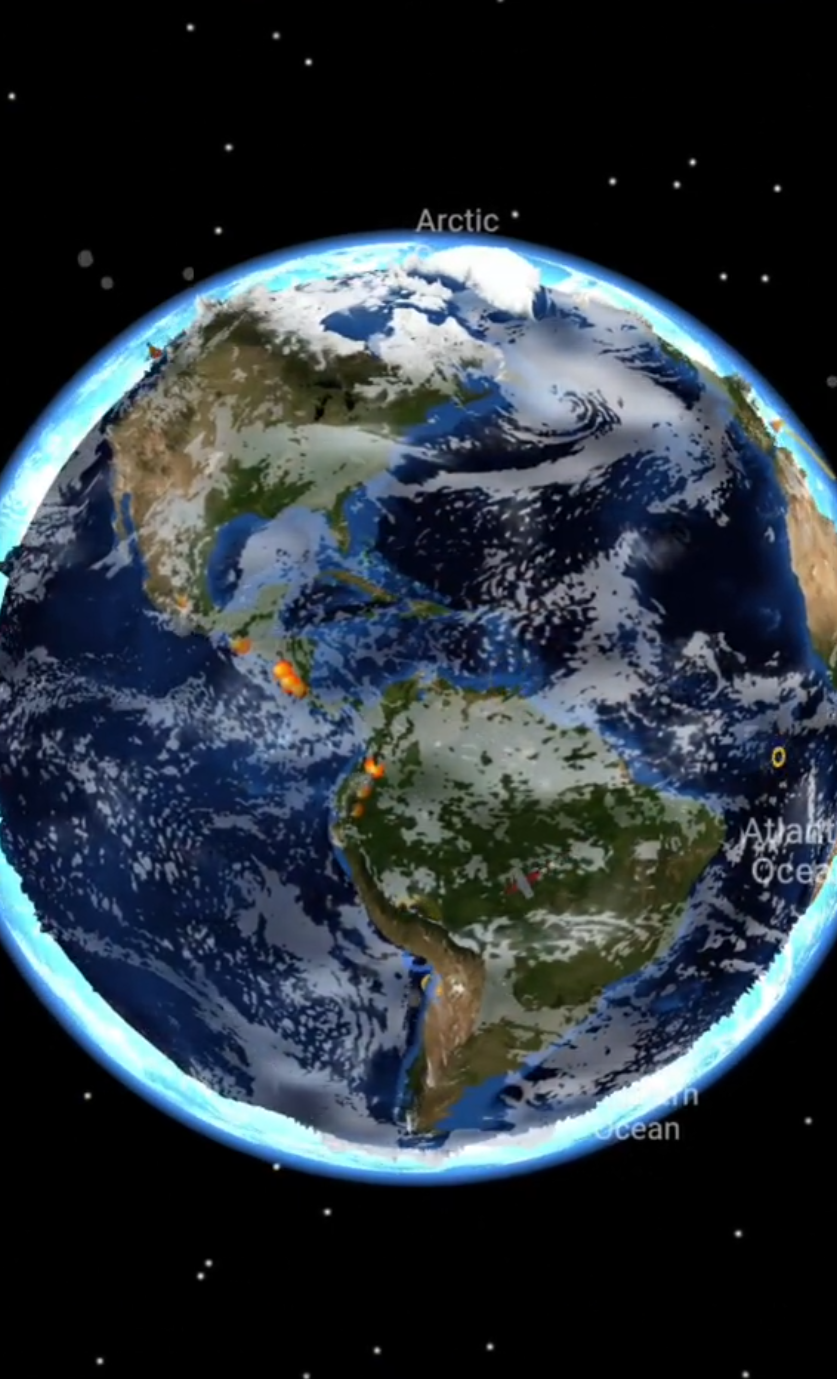
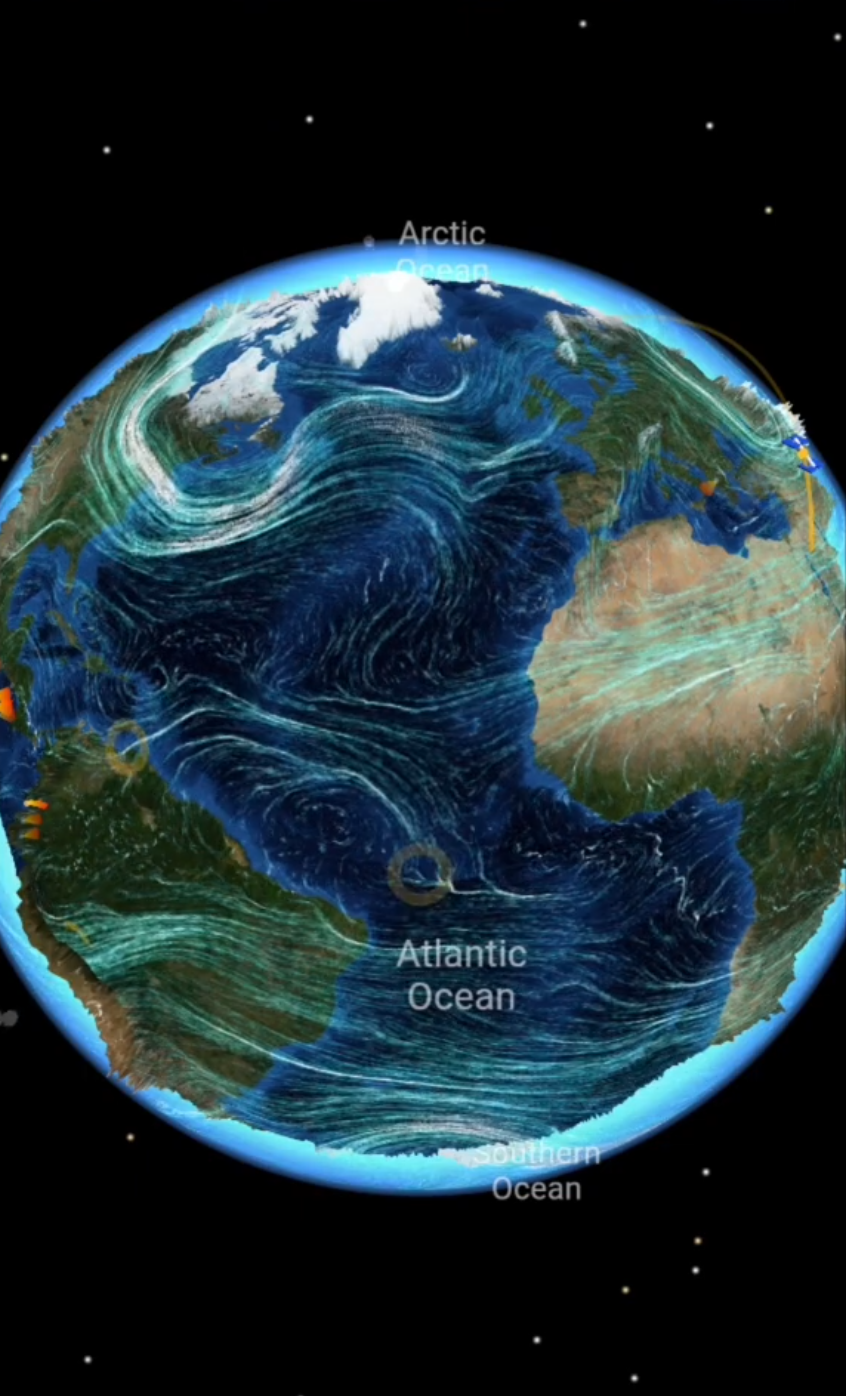
In LiveGlobe 3D, you can rotate and zoom the globe and choose available surface-wind, upper-wind, or air-pressure views in the Live menu. The web app is configured for sign-in; these layers depend on premium access and external data.
Choose a region, identify its hemisphere, and look for broad circulation patterns. Compare them with a meteorological chart whose pressure centers, legend, and valid time you can identify. Surface winds and winds aloft can differ; match times and comparable data levels before connecting patterns. For more on comparing layers, read how to interpret a Europe weather map.
Keep three questions in mind: Where is the pressure gradient? Which way does Earth’s rotation deflect the flow? How does surface friction change it? Explore LiveGlobe 3D and the views available to you and try those questions in a familiar part of the world.
Short clips
The app in motion: short, genuine glimpses straight from use.
At a glance
How the app feels on your phone.