Reading an earthquake map: magnitude, depth, and intensity explained
Understand magnitude, focal depth, and intensity. Learn to read an earthquake report and distinguish an event marker from local shaking and damage.
An earthquake map shows a dot, “M 4.8,” and “12 km.” It looks like a complete description. But how strongly did the ground shake in a particular town? Those two numbers cannot answer that on their own. Magnitude describes the size of the earthquake, focal depth locates its source underground, and intensity describes its effects at a particular place. Keeping these separate makes an earthquake report much easier to read (Swiss Seismological Service: magnitude; intensity).
Three measurements, three different questions
| Information | What does it tell you? | What does it not tell you on its own? |
|---|---|---|
| Magnitude, such as M 4.8 | The size of the event | How strongly your town shook |
| Focal depth, in kilometers | How deep the earthquake source is | The event’s size or the damage it caused |
| Intensity, on a named scale | The effects at a particular location | A single size that applies to the whole earthquake |
The useful shorthand is magnitude belongs to the event; intensity belongs to a place. Depth adds the third dimension. An intensity level and a magnitude value are not interchangeable.
Epicenter and hypocenter: the dot is at the surface
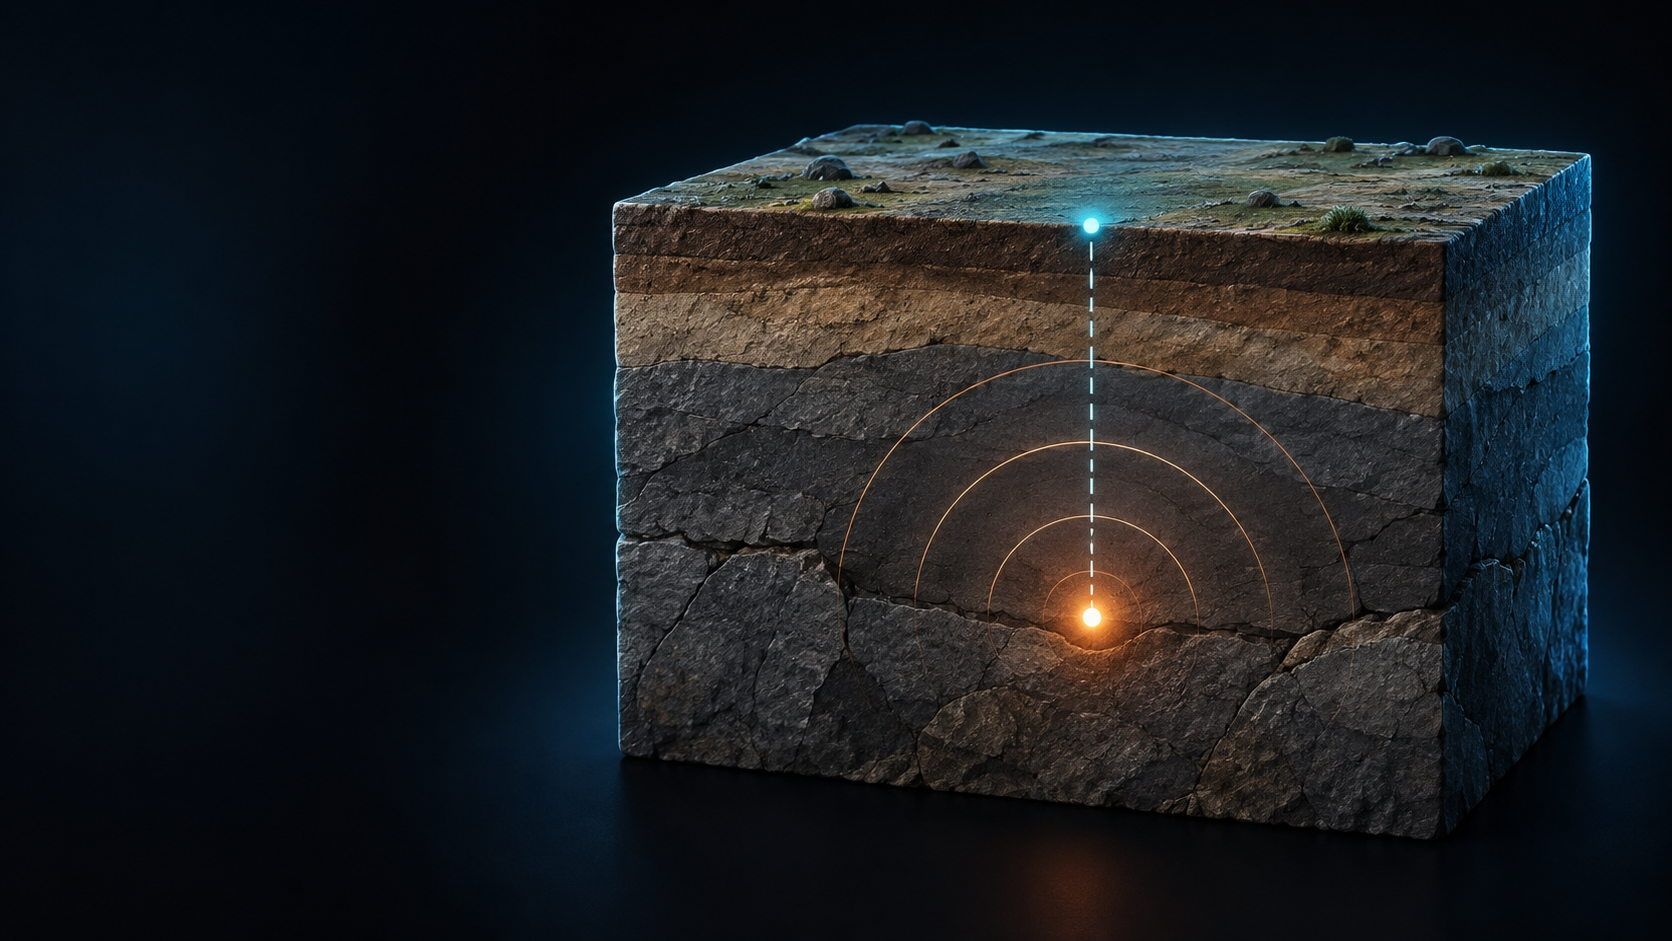
The underground source is the hypocenter, also called the focus. Its location is described by latitude, longitude, and depth. The epicenter is the point on Earth’s surface directly above it (Swiss Seismological Service: hypocenter and epicenter).
Imagine a simple cross-section through the ground. A point in the rock represents the source of seismic waves. A vertical line from that point to the surface reaches the epicenter. A map can show the surface position, but you need the depth to picture the source beneath it.
That dot locates the event. It does not outline the area damaged by it. Even a large circle around the marker only becomes meaningful once you know what its size represents in the map legend.
Magnitude measures event size, not damage to a town
Magnitude is determined from seismic measurements. Its scale is logarithmic: an increase of one magnitude unit corresponds to roughly 30 times as much released energy. A magnitude 6 event therefore releases about 30 times the energy of a magnitude 5 event (Swiss Seismological Service: magnitude).
This is an energy comparison between earthquakes. It does not mean every building shakes 30 times harder or suffers 30 times as much damage. Distance, local ground conditions, and construction also matter.
Check the letters next to the number. ML denotes local magnitude, the method associated with the Richter scale; Mw denotes moment magnitude. These are different methods, so not every magnitude should be called “Richter.” If a report only says “M,” consult the publisher’s explanation rather than supplying a magnitude type yourself (magnitude types).
Depth adds a dimension that the map cannot show
Focal depth is not your distance from the epicenter along the surface. Even directly above the source, you still have rock between you and the focus.
Shallow earthquakes can be felt more strongly nearby than deeper events of comparable size. The Swiss Seismological Service discusses this in its explanation of earthquake depth in Switzerland. It does not produce a simple conversion such as “twice as deep means half the shaking.” Distance, the waves’ path, and local geology also influence the effects.
A depth of 12 km is a location measurement. It does not mean magnitude 12, and it does not tell you the radius over which people felt the earthquake.
Intensity changes from place to place
Intensity describes how an earthquake was experienced and what effects it had at a specific location. One example is the European Macroseismic Scale EMS-98, with levels I to XII, traditionally written as Roman numerals. This is separate from the magnitude scale (EMS-98 explanation).
Magnitude, distance from the focus, and local geology influence intensity. Two towns affected by the same earthquake need not experience the same shaking. Building construction matters when assessing actual damage.
Traditional intensity assessments use observations and effects. Instrumental intensity can also be derived from measured ground motion. When reading a map, ask whether it uses felt reports, measurements and modeling, or a combination. A number without a scale and a location is missing essential context.
Work through a fictional report
For practice only, imagine an external report reading “M 4.8 · depth 12 km · 10:15 UTC,” with a marker near a coastline. This is not a real earthquake.
- Match the event and time. Does the marker belong to this report? Check the date and time zone; UTC is not automatically your local time.
- Read the magnitude. 4.8 describes event size. If the method is not specified, check the source’s notes.
- Add the depth. The reported source is 12 km underground. The source and the surface marker are different points in space.
- Look for local effects. The report does not yet tell you how strongly a nearby coastal town shook. Look for an intensity map or professionally interpreted felt reports.
- Check status and symbols. Is this an automatic estimate or a reviewed report? What do the marker’s color and size mean?
The supported conclusion is that an event of the stated size and depth was reported. Assigning an intensity level or predicting damage in the coastal town would require more information.
An earthquake map is not the same as a ShakeMap
An event map mainly answers “Where did the earthquake happen?” A ShakeMap estimates the spatial distribution of shaking and related effects, combining station measurements with models. Such maps can be preliminary, and small-scale differences are only approximated (Swiss Seismological Service: ShakeMap).
Start with the map title and legend. Red has no universal meaning across earthquake maps, and a ShakeMap is not an inspection of an individual house.
Also distinguish an automatic first estimate from a reviewed assessment. The service’s earthquake announcements explicitly label that status. For a particular event, use the current report from the responsible scientific service.
Explore the geographic context with LiveGlobe 3D
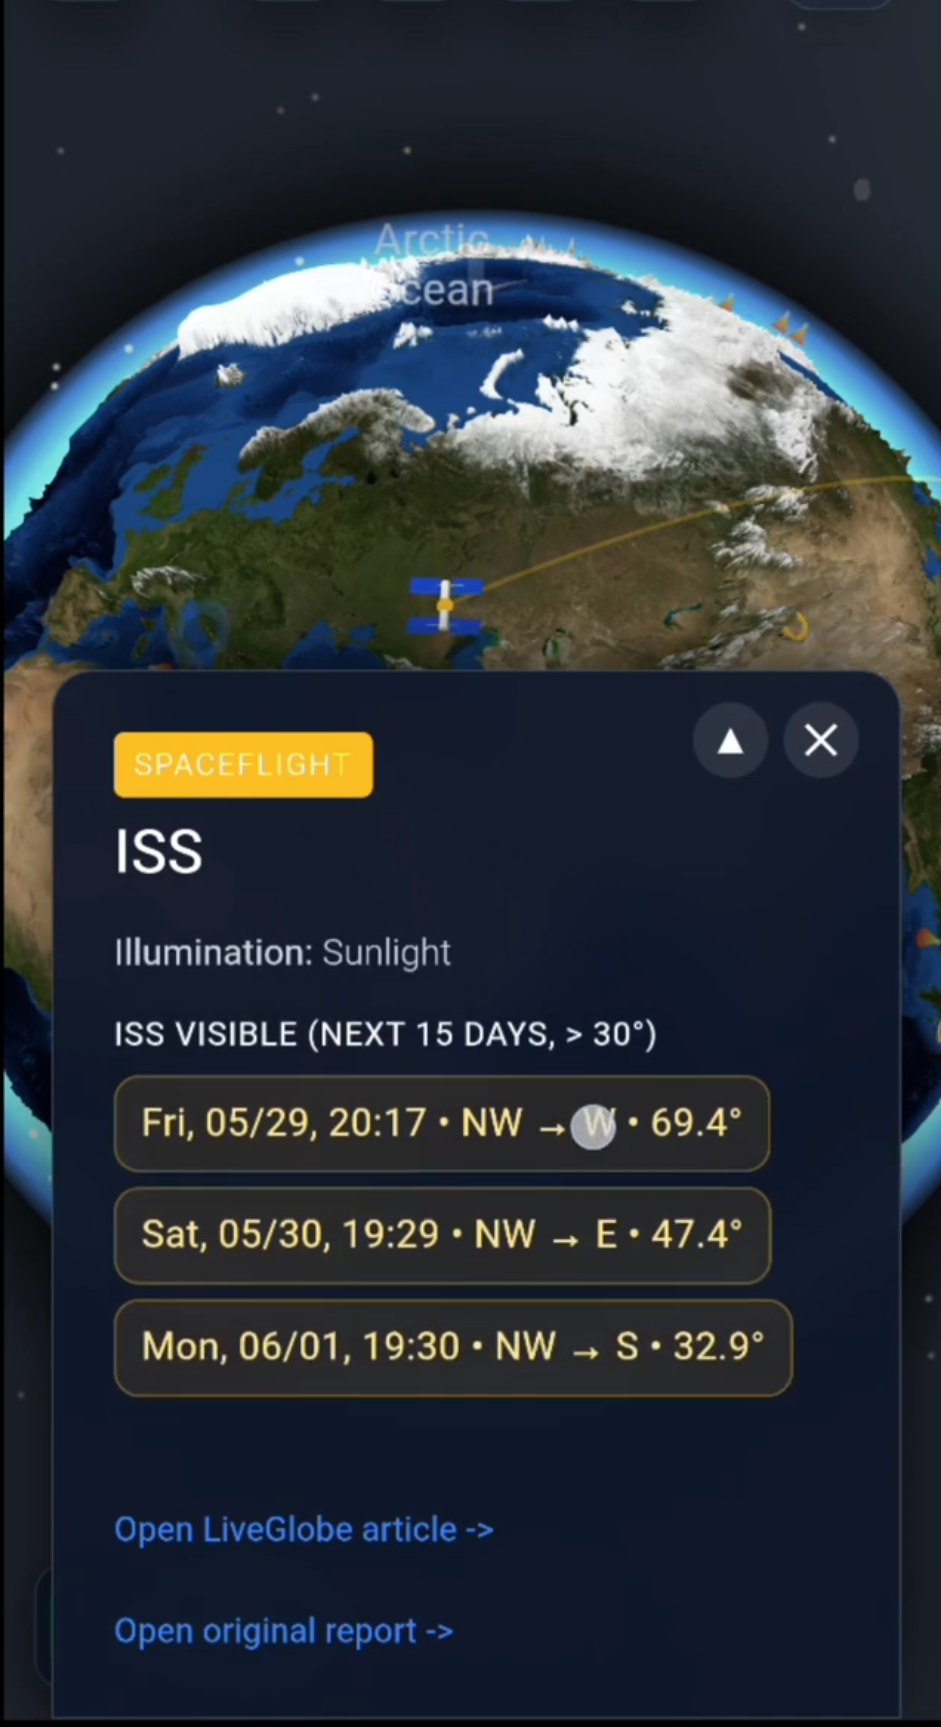
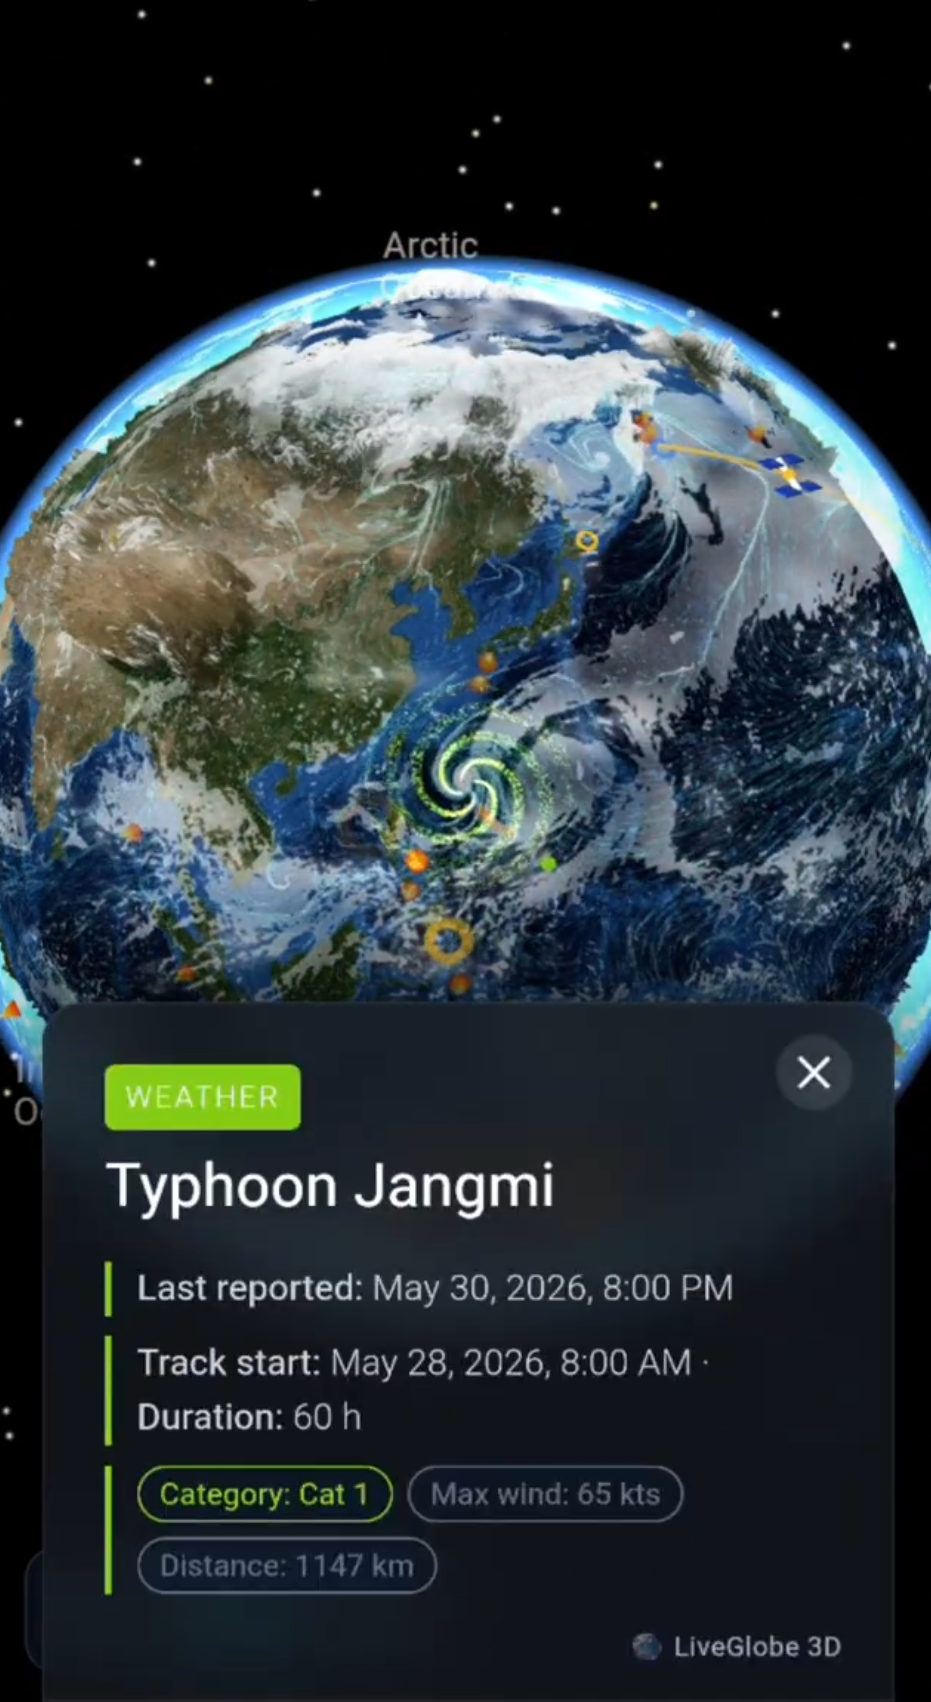
In LiveGlobe 3D, you can rotate and zoom the globe, enable the earthquake layer in the live menu, and open the event list through the information icon. A clickable entry takes you to the associated location. Web access requires sign-in; the earthquake layer may require Premium access and depends on available external data.
Use the globe to locate the region and notice surrounding coastlines and places. Then read magnitude, depth, and local effects in the scientific report. The two views complement each other without turning a marker into a damage assessment.
Visit the LiveGlobe 3D main site to explore the available views.
Common questions
Is every magnitude a Richter-scale value?
No. Local magnitude ML is associated with Richter, while other methods include moment magnitude Mw. Read the abbreviation and the source’s explanation.
Can one earthquake have several intensities?
Yes. Intensity is location-dependent, so one event can have different effects in different places. Magnitude characterizes the event itself.
Can magnitude and depth tell me how much damage occurred?
Not for a specific town or building. Distance, ground conditions, and construction also matter. Look for local scientific information rather than estimating damage from the marker.
Short clips
The app in motion: short, genuine glimpses straight from use.
At a glance
How the app feels on your phone.